Leave a Message

Thank you for your message. We will be in touch with you shortly.

Silicon Valley Newsletter - June 2026

Real Estate

Silicon Valley Newsletter - June 2026

The Big Story

Quick Take:
  • Median home sale prices surged past last year's levels in May, as the spring selling season continues to build momentum.
  • Inventory levels have climbed back to where they were at this time last year, giving buyers more options heading into the summer.
  • Existing home sales posted their strongest year-over-year gain in quite some time, signaling that buyers are finally coming off the sidelines.

Note: You can find the charts & graphs for the Big Story at the end of the following section.

*National Association of REALTORS® data is released two months behind, so we estimate the most recent month's data when possible and appropriate.
 

The spring rally is in full swing

The spring selling season has delivered exactly the kind of price action that sellers were hoping for. The median home sold for $429,300 in May, representing a 2.83% month-over-month increase and a 1.32% year-over-year gain. This marks the fourth consecutive month of month-over-month price increases since the market bottomed out at $395,000 in January, and it's the highest median sale price we've seen since last summer. Helping fuel this rally is the fact that mortgage rates have come back down a bit after their April spike, settling at 6.37% in May, which is 5.77% lower than the 6.76% we were seeing at this time last year. That said, the median monthly P&I payment came in at $2,201, which is only 2.57% lower than the $2,259 the median homeowner was paying a year ago. The affordability gap is narrowing, as rising prices are beginning to eat into the savings that lower rates have provided. It'll be worth keeping a close eye on this dynamic as we move deeper into the summer months.

Inventory is back to last year's levels just in time for the summer rush

After spending much of the winter and early spring playing catch-up, inventory levels have finally returned to where they were at this time last year. In May, there were 1,550,000 homes available for sale, representing a 0.65% year-over-year increase and a 3.33% month-over-month gain. While the year-over-year increase is modest, it's encouraging to see inventory keeping pace with last year's levels, especially considering how tight supply has been for the past several years. On the new listings front, 474,976 new listings hit the market in May, representing a 2.12% year-over-year increase, though this was a slight 0.45% decline from April's pace. This tells us that sellers are still actively listing their homes, but the initial spring rush may be tapering off just a bit. If inventory continues to build through June and July, buyers heading into the summer could find themselves with the most options they've had in years.

Buyers are back, and they're buying

Perhaps the most encouraging data point this month is the significant uptick in existing home sales. In May, 4,170,000 homes changed hands, representing a 3.22% increase on both a month-over-month and year-over-year basis. This is a meaningful shift from the sluggish sales figures we've been tracking over the past several months, and it suggests that the combination of lower mortgage rates and growing inventory is finally pulling buyers off the sidelines. It's also worth noting that this is the highest existing home sales figure we've seen since December, when the market saw its seasonal year-end push. If this momentum carries through the summer, we could be looking at one of the more active selling seasons we've seen in recent years. Of course, the big wildcard here is mortgage rates. If rates continue to decline, it could add even more fuel to the fire. But if they tick back up, as they did in April, it could pump the brakes on what has been a very promising start to the summer.

The tug-of-war between buyers and sellers continues

When determining whether a market is a buyers' market or a sellers' market, we look to the Months of Supply Inventory (MSI) metric. The state of California has historically averaged around three months of MSI, so any area with at or around three months of MSI is considered a balanced market. Any market that has lower than three months of MSI is considered a seller's market, whereas markets with more than three months of MSI are considered buyers' markets.

Right now, the national market finds itself in an interesting position. Inventory is growing, but existing home sales are growing right along with it, which means the months of supply on the market hasn't shifted dramatically in either direction. The fact that both supply and demand are ticking up simultaneously tells us that we're in a relatively balanced market at the national level. However, the direction of mortgage rates over the next couple of months will likely determine which way the scale tips. If rates continue their downward trajectory, demand could outpace supply, pushing us back toward a seller's market. On the other hand, if rates climb again, inventory could pile up, giving buyers the upper hand. As always, real estate is a highly localized asset, which is why you should check out what's going on in your local market below in the Local Lowdown!

Big Story Data

The Local Lowdown

Quick Take:
  • Single-family median sale prices showed a split picture in May, with San Mateo County posting strong gains while Santa Clara and Santa Cruz Counties experienced year-over-year declines.
  • Inventory levels have dropped significantly, with single-family home inventory down nearly 19% year-over-year as demand continues to outpace supply.
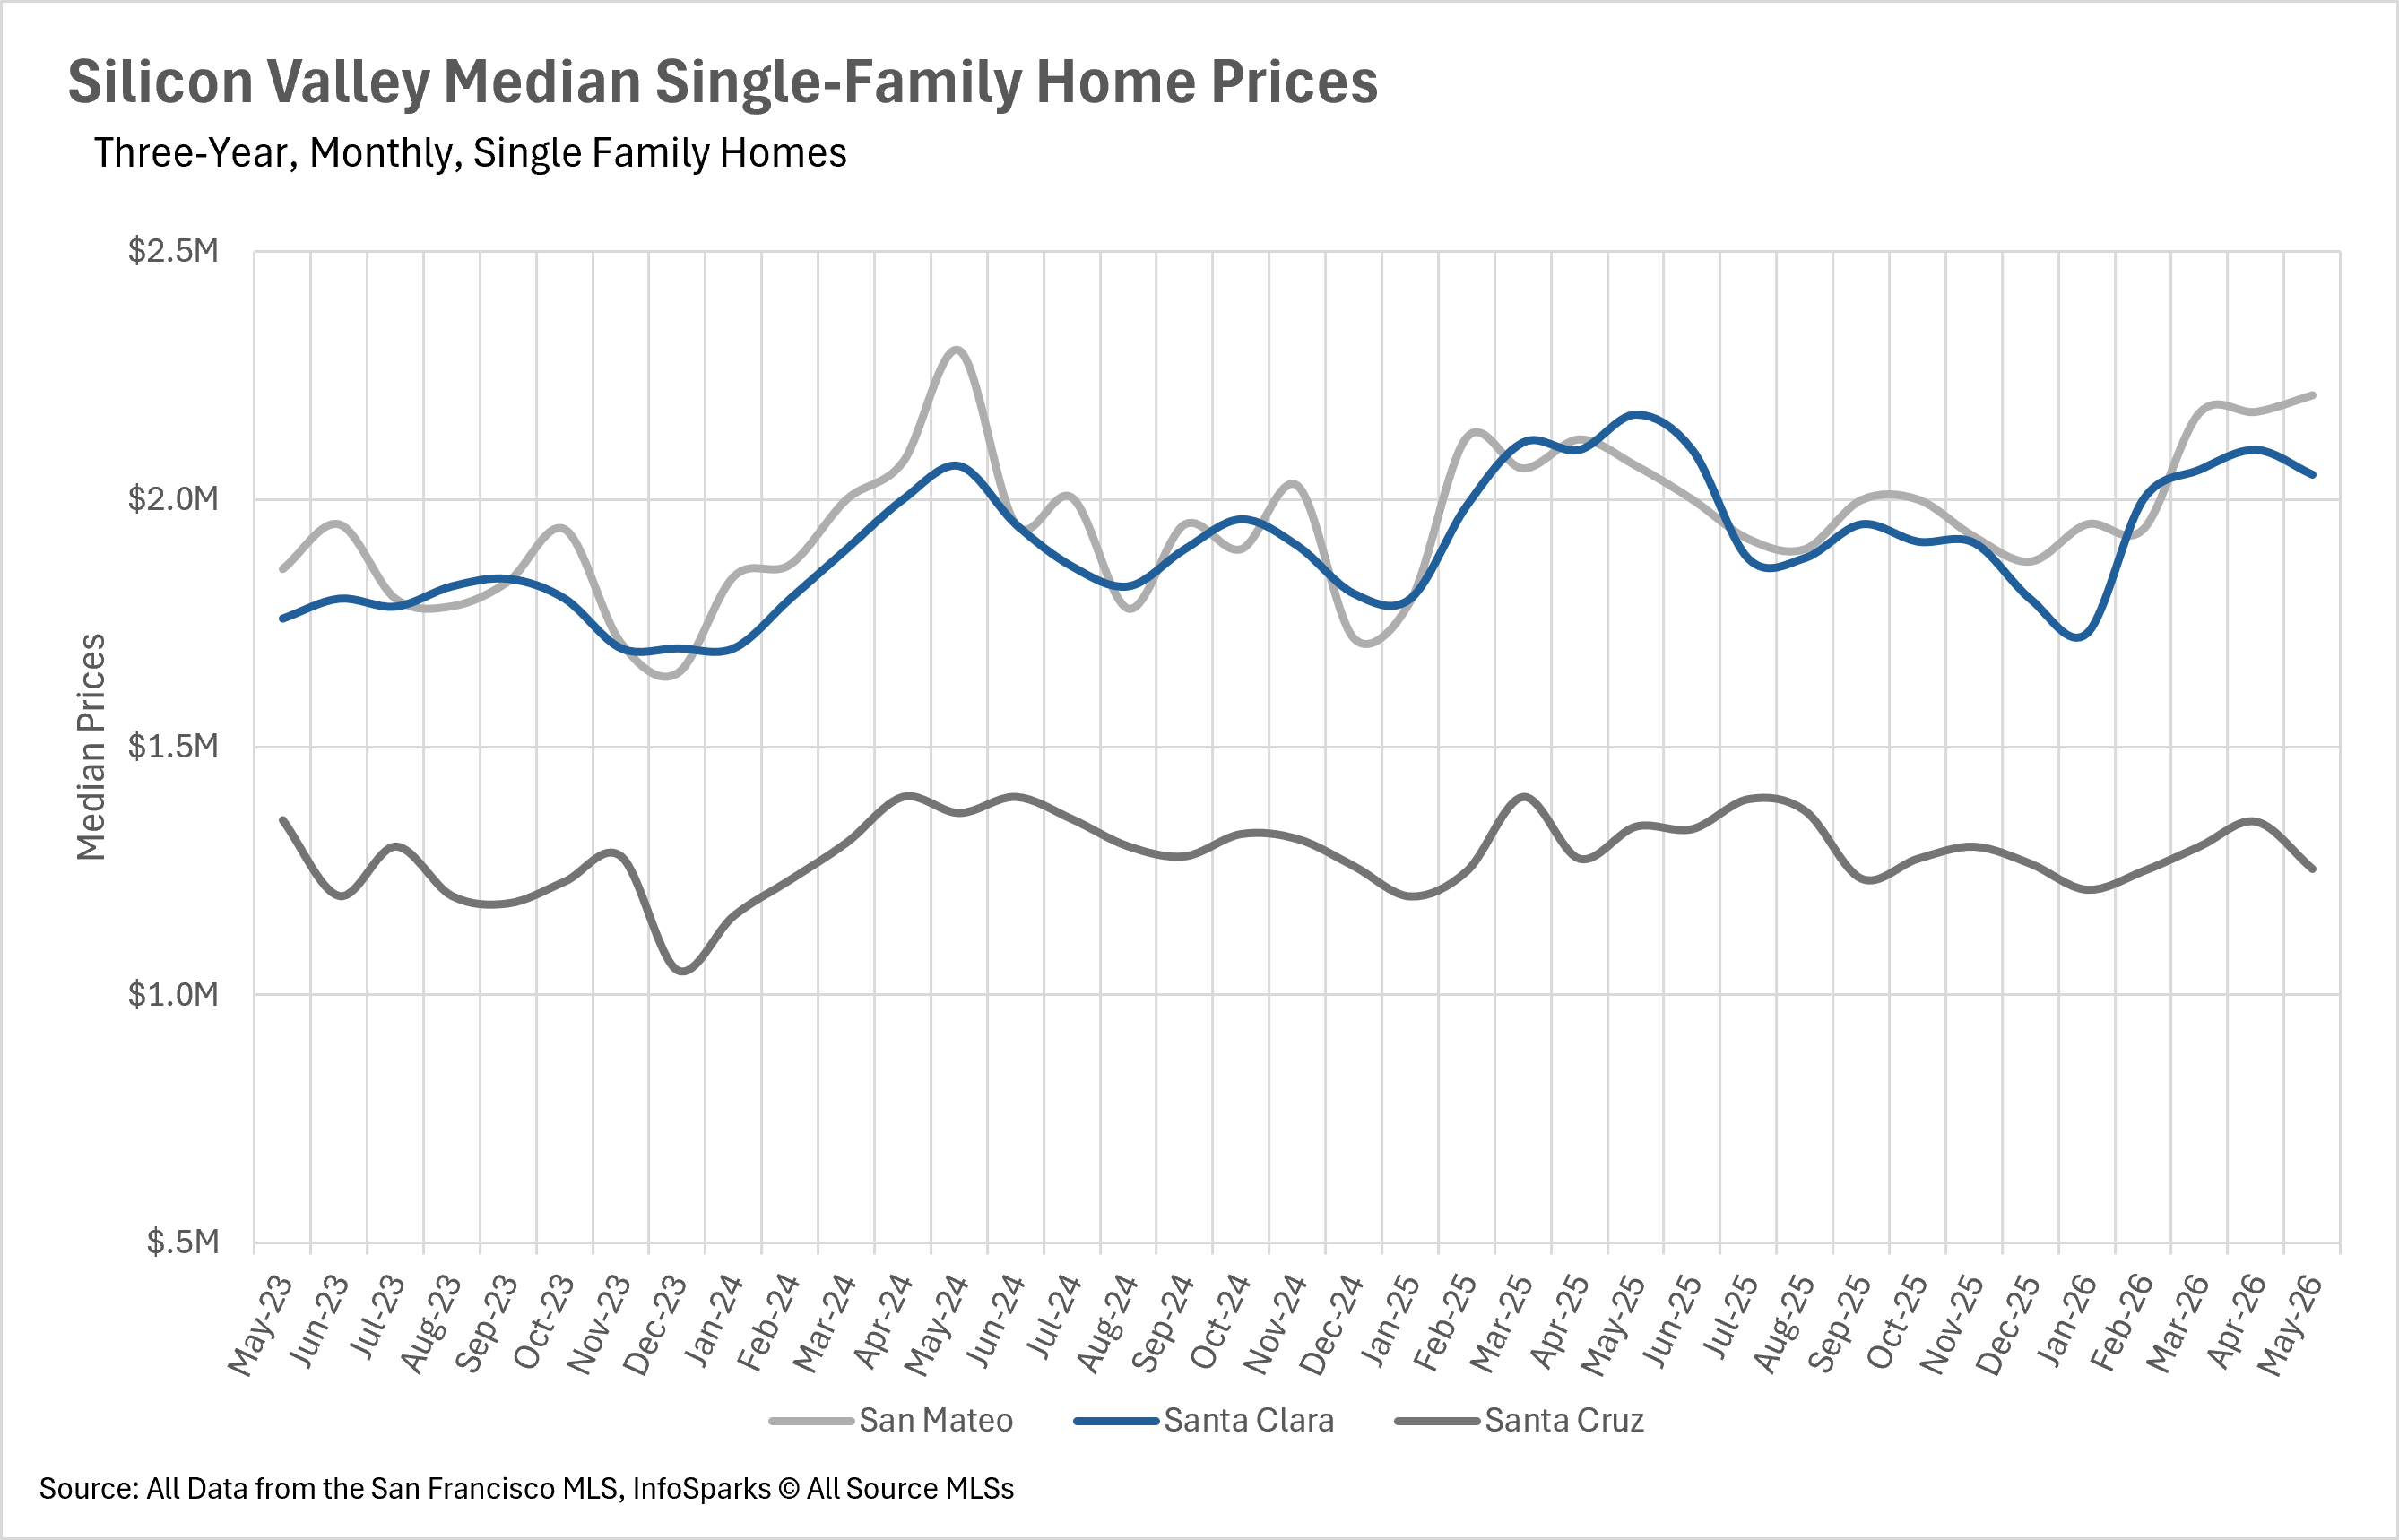
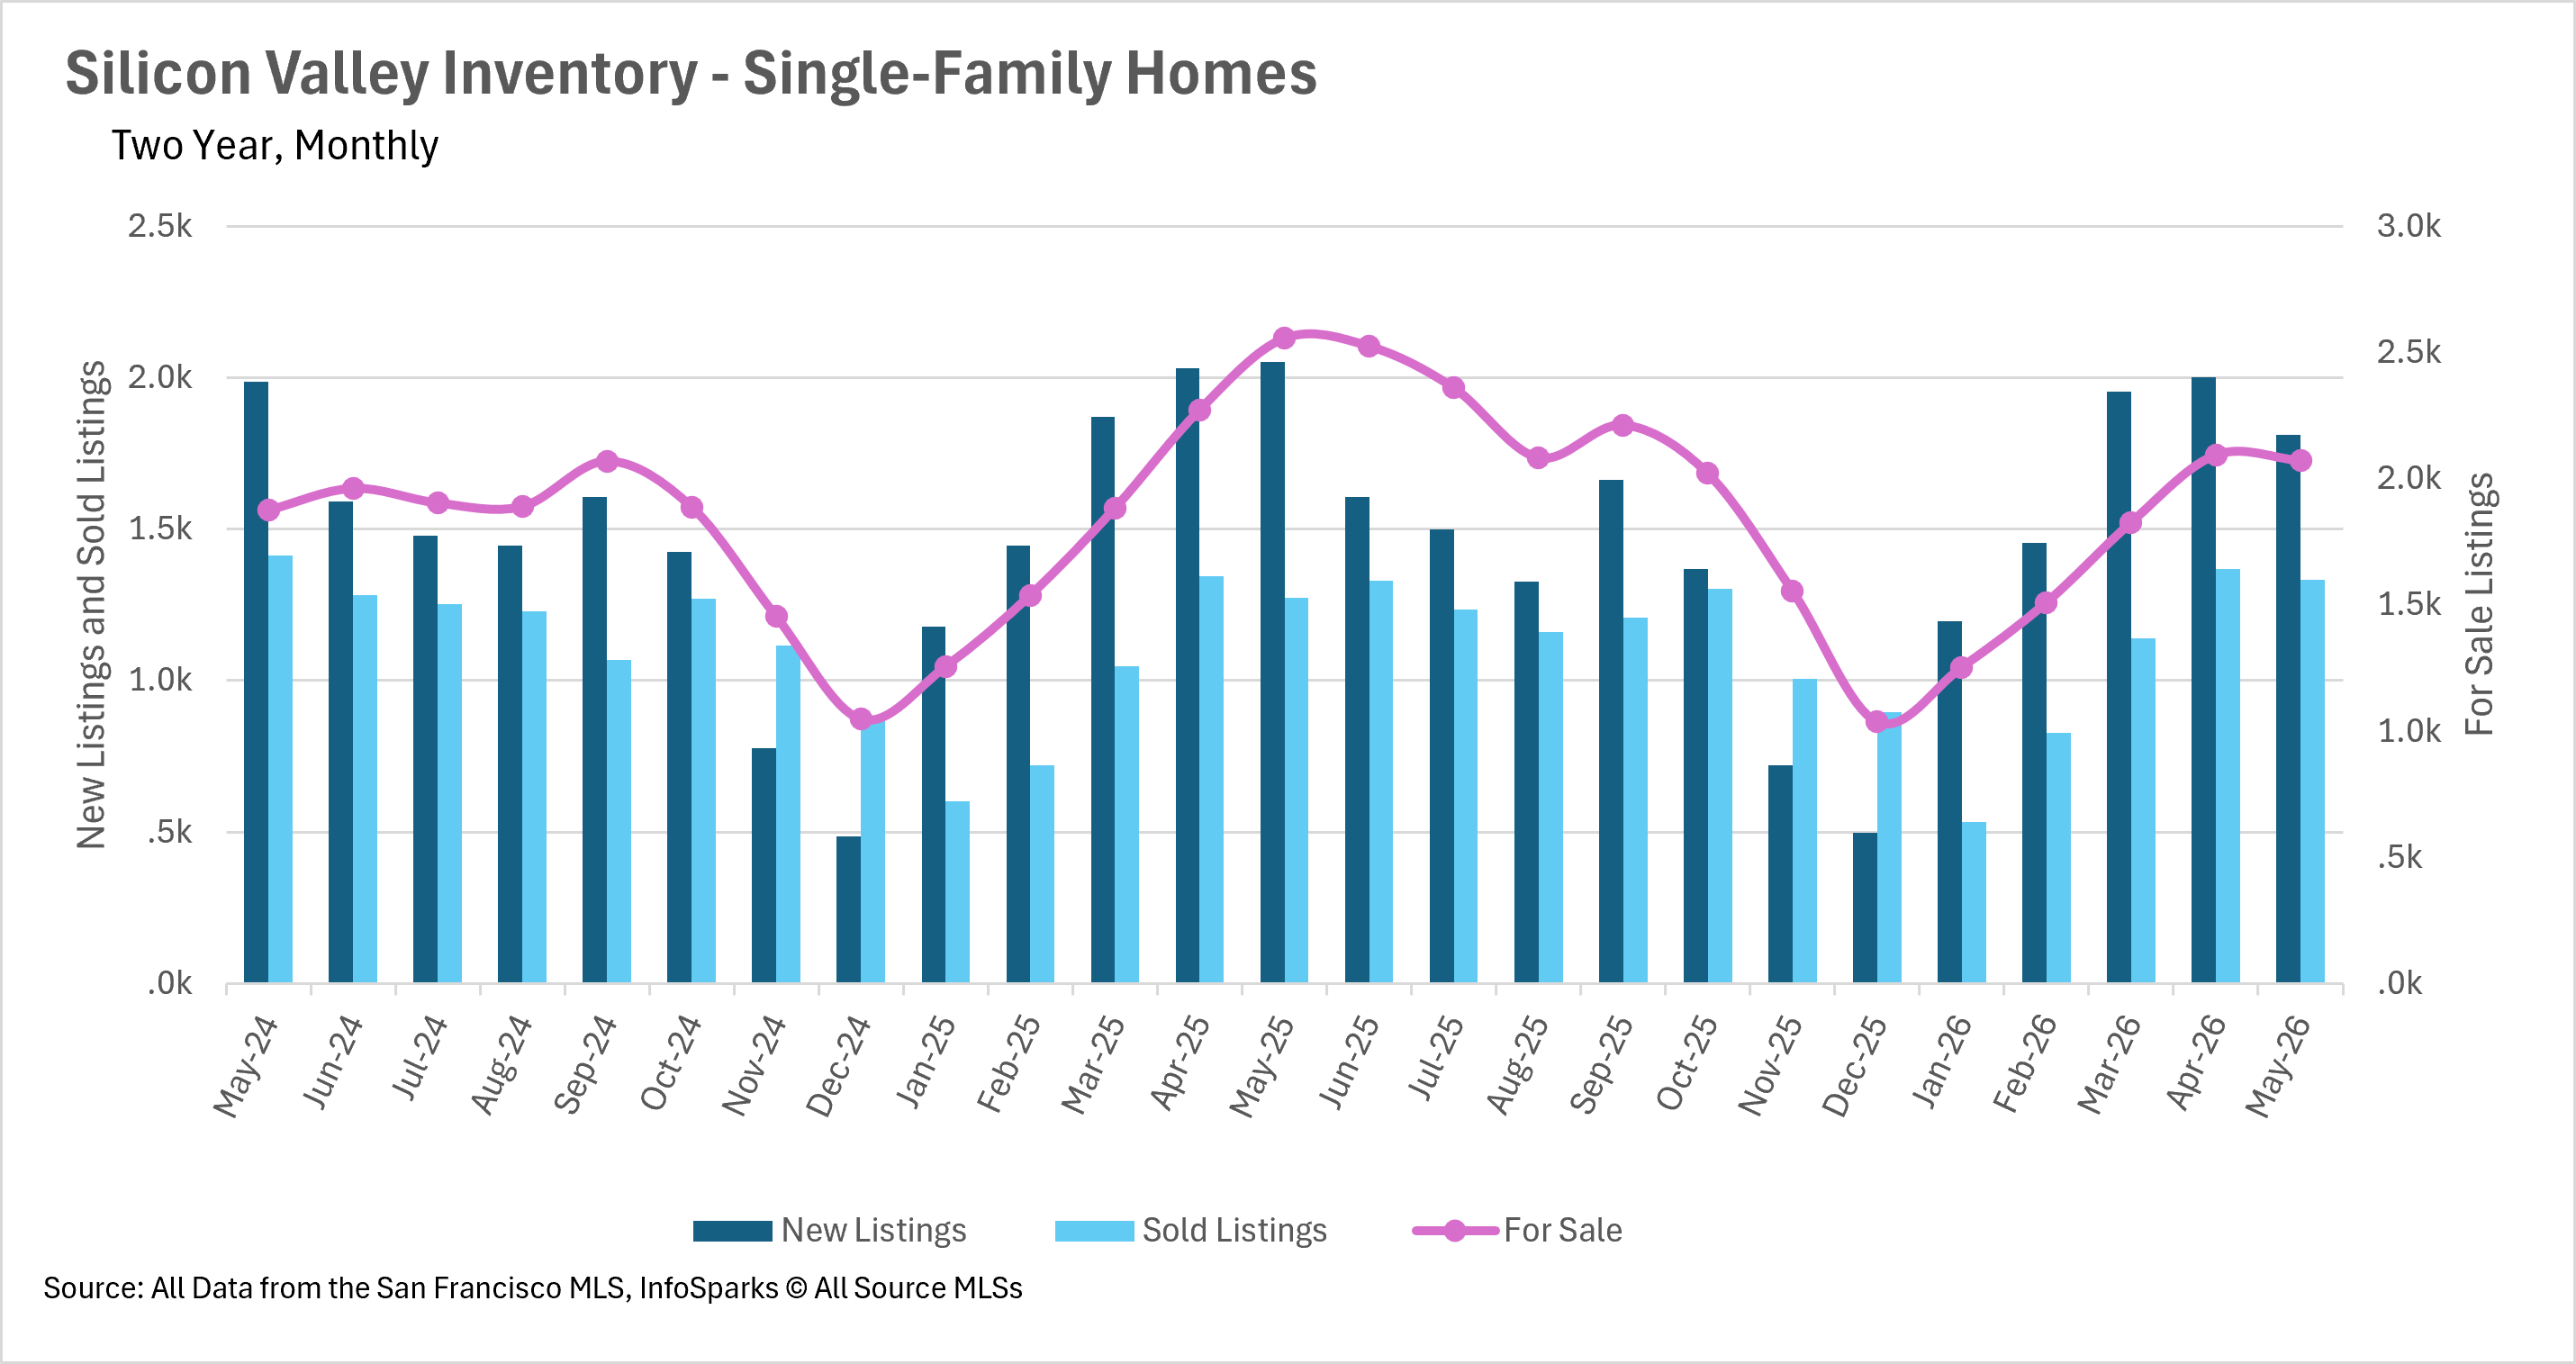
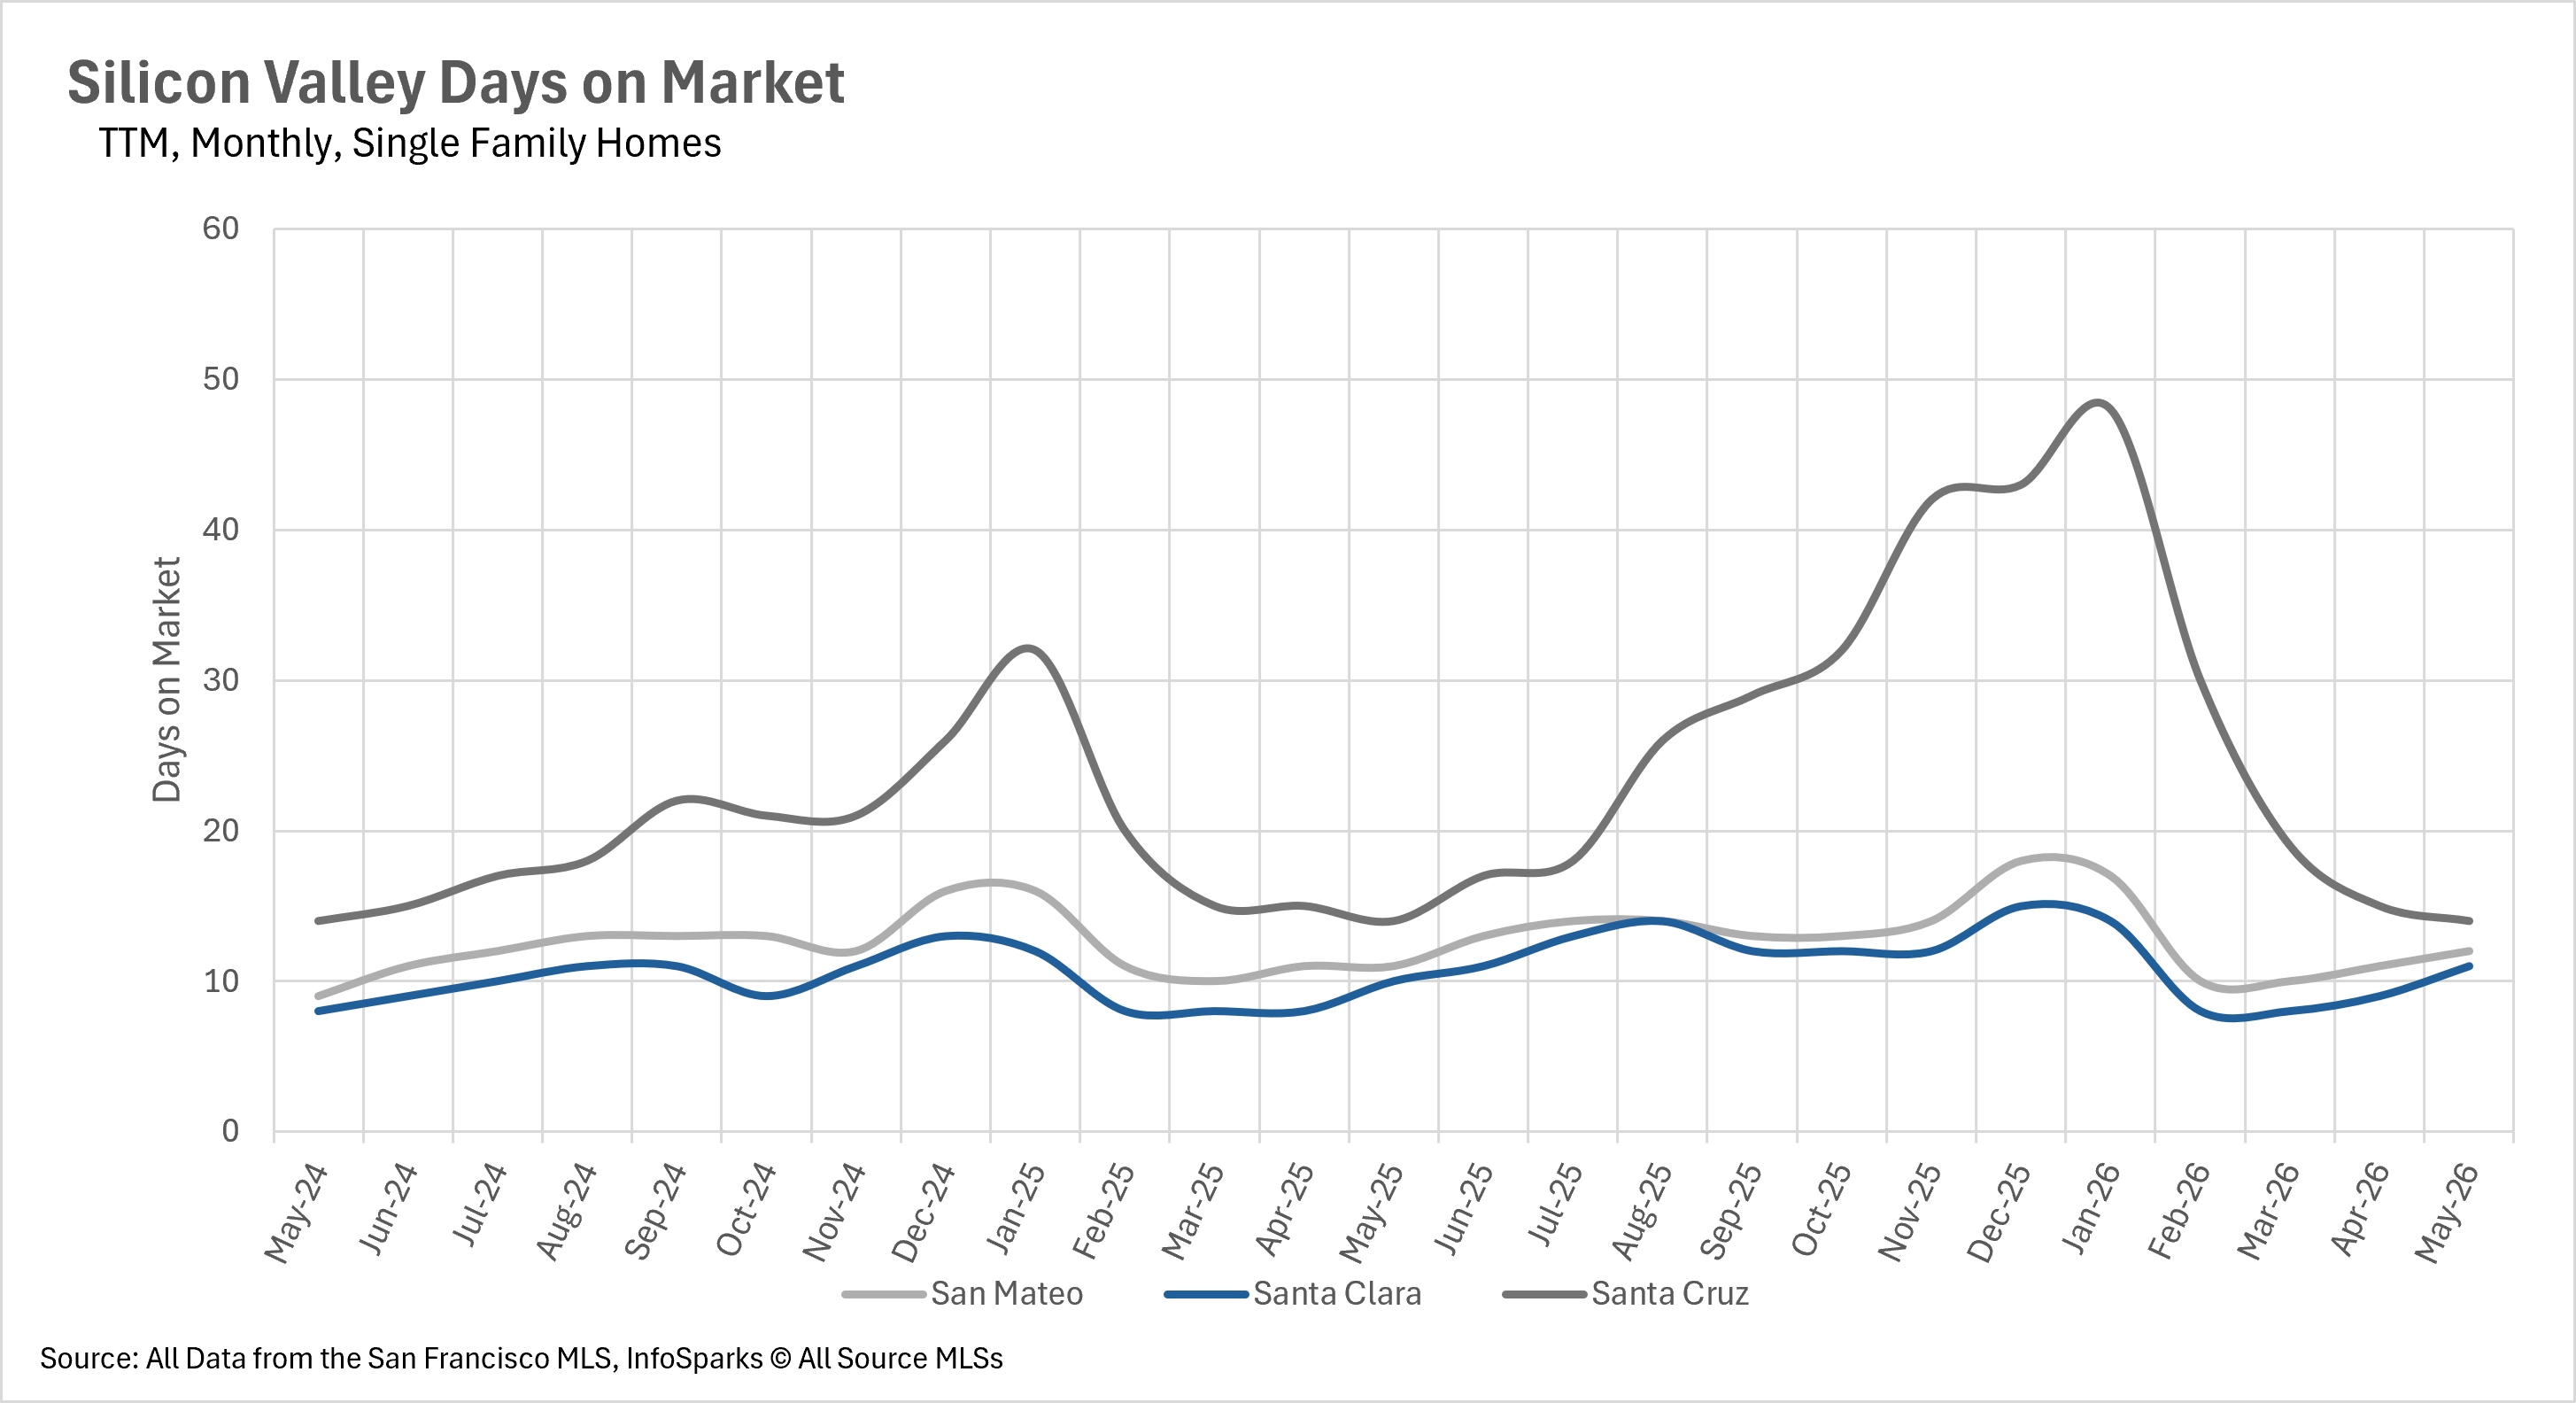
  • Single-family homes continue to sell quickly across the region, with the average listing spending just 11 to 14 days on the market.

    Note: You can find the charts/graphs for the Local Lowdown at the end of this section.

San Mateo County surges while the rest of Silicon Valley pulls back

The single-family home market in Silicon Valley showed divergent trends in May as we head into the summer selling season. San Mateo County posted an impressive 6.87% year-over-year increase in median sale price, with the median home selling for $2,210,000. However, Santa Clara County saw a notable 5.58% year-over-year decline, with the median home selling for $2,050,000, while Santa Cruz County dropped 6.38% to $1,254,500. The condo market told a completely different story, with dramatic gains in two of the three counties. San Mateo County condos surged 24.06% year-over-year to $842,400, and Santa Cruz County condos skyrocketed 36.51% to $860,000. However, Santa Clara County condos continued to struggle, declining 8.85% year-over-year to $711,000.

Inventory plunges as buyer demand remains strong

The inventory situation in Silicon Valley has tightened considerably as we move into summer. There are currently 2,071 single-family homes for sale across the region, representing a substantial 18.94% year-over-year decline. New listings are also down 11.79% compared to last year, while sold listings are up 4.47%, indicating that demand continues to absorb available supply at a faster rate than new inventory is entering the market. The condo market is experiencing similar constraints, with 896 condos currently for sale, down 9.77% year-over-year. This persistent inventory shortage is creating an increasingly competitive environment for buyers across both segments of the market.

Single-family homes continue to fly off the shelves

Single-family homes are selling at a rapid clip throughout Silicon Valley as we head into summer. In San Mateo County, the average single-family home is selling in just 12 days, while Santa Clara County homes are spending an average of 11 days on the market. Santa Cruz County homes are also moving quickly at 14 days on average, unchanged from this time last year. While San Mateo and Santa Clara Counties saw slight year-over-year increases in days on market of 9.09% and 10.00% respectively, these figures still represent an incredibly fast-paced market. The condo market is showing improvement in most areas, with San Mateo County condos selling 15.15% faster than last year at 28 days, and Santa Cruz County condos moving 37.84% faster at just 23 days. Santa Clara County condos are the exception, taking 38.89% longer to sell at 25 days on average.

Silicon Valley is deeply entrenched in seller's market territory

When determining whether a market is a buyers' market or a sellers' market, we look to the Months of Supply Inventory (MSI) metric. The state of California has historically averaged around three months of MSI, so any area with at or around three months of MSI is considered a balanced market. Any market that has lower than three months of MSI is considered a seller's market, whereas markets with more than three months of MSI are considered buyers' markets.
The single-family home market has become an even stronger seller's market compared to last year. San Mateo County has just 1.4 months of supply on the market, representing a dramatic 39.13% year-over-year decline. Santa Clara County has 1.8 months of supply, down 10% from last year, while Santa Cruz County has 3.1 months of supply, a substantial 34.04% year-over-year decrease. The condo market is more balanced, with San Mateo County at 3.5 months of supply (down 22.22% YoY), Santa Clara County at 4.3 months (up 10.26% YoY), and Santa Cruz County at 3.9 months (down 40.91% YoY). With single-family inventory at critically low levels and homes selling in under two weeks, buyers in that segment should be prepared for fierce competition this summer!

Local Lowdown Data

📞 Contact Patrice Horvath today at (650) 520-7675 

Patrice and the Illuminate Properties team specialize in helping Palo Alto, Mountain View, Los Altos, Los Altos Hills, Menlo Park, Portola Valley, Redwood City, San Carlos, Sunnyvale, and Woodside buyers and sellers navigate today’s evolving market with confidence.


Here's the Silicon Valley Monthly Market Update 2026

Recent Blog Posts

Stay up to date on the latest real estate trends.

LET'S TALK

You’ve got questions and we can’t wait to answer them.