Silicon Valley Newsletter - June 2024
Real Estate

Real Estate
Note: You can find the charts & graphs for the Big Story at the end of the following section.
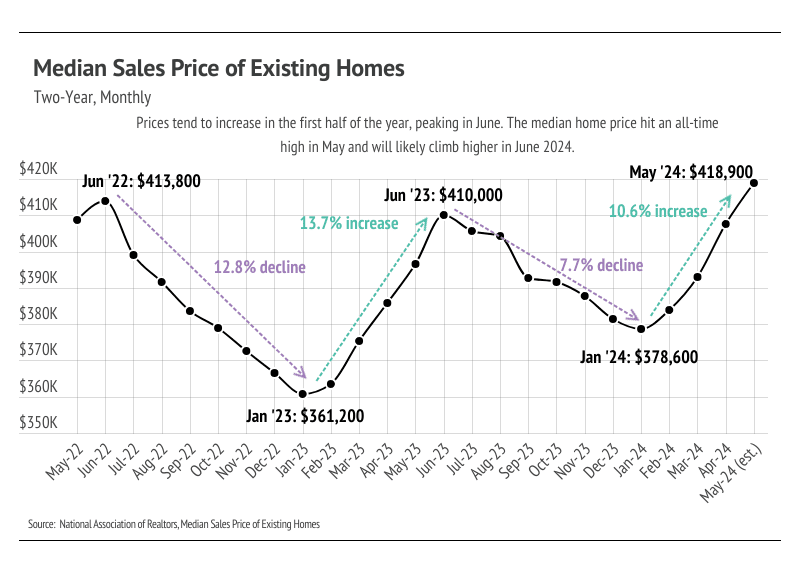
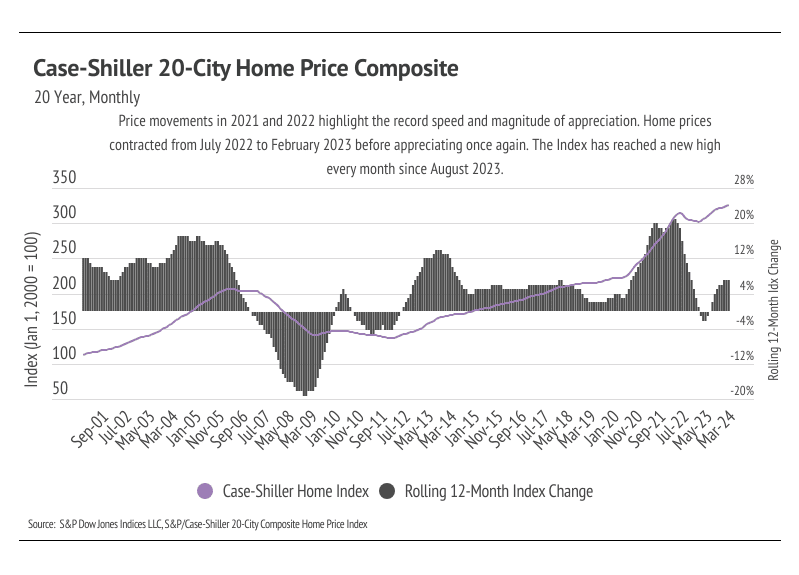
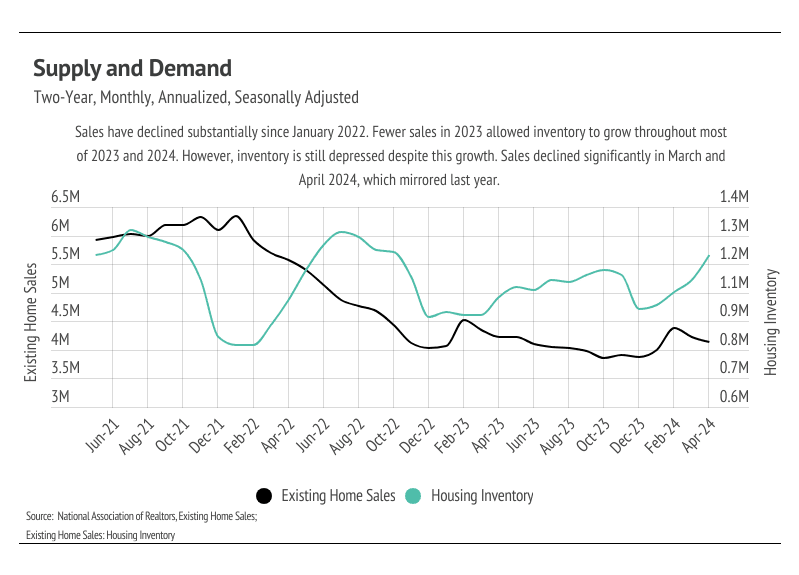
According to the National Association of Realtors® (NAR), the median sales price for existing homes grew 5.6% to $418,900 between May 2023 and the present — the eleventh consecutive month of year-over-year price growth, and the highest median price ever reached. Typically, the median price peaks in June each year, so we will likely see prices climb even higher when the data comes in for this month. In addition to NAR, the Case-Shiller 20-City Composite Home Price Index, which measures the aggregate price level of homes in the largest 20 metropolitan statistical areas, has reached a new high for the eighth month in a row. The combination of elevated mortgage rates and rising prices has brought affordability to an all-time low, which translates to fewer sales and growing inventory. However, at the same time, homes are spending less and less time on the market.
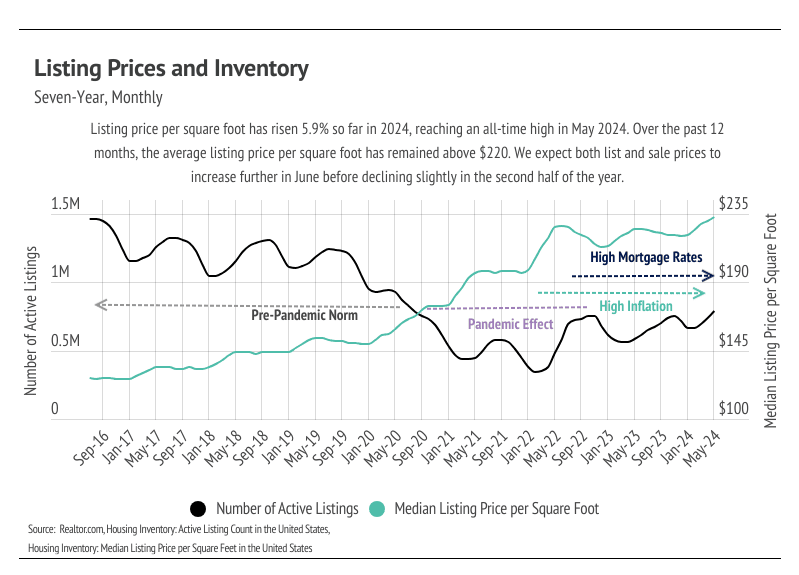
Demand is still high relative to supply, even though inventory is building. The buyers that haven’t been priced out of the market are moving quickly on homes that suit them. Despite the high demand and quick market, there are simply fewer buyers in the market. Higher mortgage rates can only lead to fewer market participants. On the bright side, inventory growth is great news for the wildly undersupplied U.S. housing market. According to data from realtor.com, inventory reached its highest level since August 2020. The market is still broadly undersupplied, but the increasing inventory level should cause rising home prices to slow. Decreasing home prices mid-year is also normal on a seasonal basis. In the pre-pandemic seasonal trends, sales, new listings, inventory, and price would roughly all rise in the first half of the year and decline slightly in the second half of the year. Sales and new listings have been far lower than usual since mortgage rates started climbing, which is to be expected.
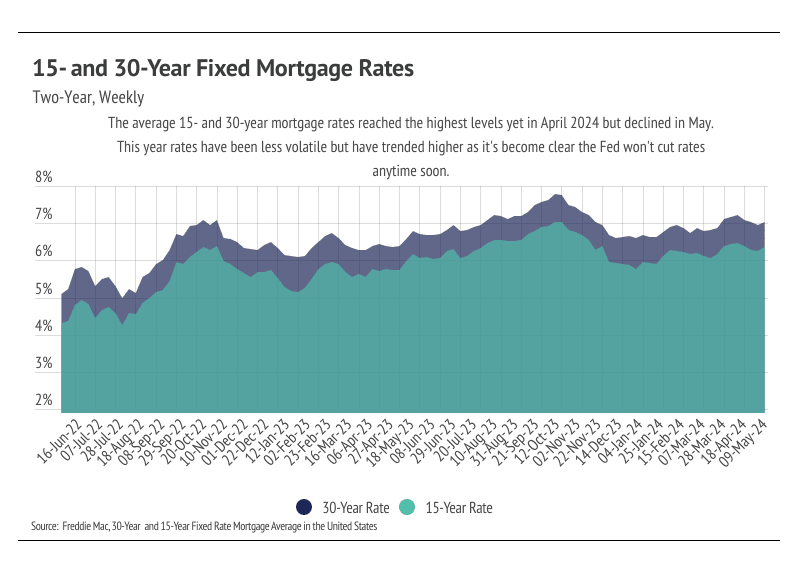
The average 30-year mortgage rate began the year at 6.62% and landed at 7.03% at the end of May, marking the third year mortgage rates have been elevated. At the start of the year, rate expectations were far different from those today. In January, inflation still appeared to be trending lower, and economists were predicting rate cuts as early as March. However, in hindsight, inflation stopped trending lower in June 2023 and has held fairly steady around 3.3% since then. The Fed targets an inflation rate of 2%, so we aren’t expecting rate cuts anytime soon. In fact, the safest bet may be to not expect any rate cuts in 2024. The Fed’s dual mandate aims for stable prices (inflation ~2%) and low unemployment, so it’s all about inflation, especially because the job market is still strong.
During the Fed’s May meeting, the Federal Reserve Board unanimously voted to hold policy rates steady for the sixth consecutive time, leaving the federal funds target rate unchanged at 5.25% to 5.50%. Although this letter was written before the June 11-12 Fed meeting, we are confident the Fed will hold rates steady. If there’s a silver lining, it’s that even though rate cuts are extremely unlikely, rate hikes are even less probable.
Different regions and individual houses vary from the broad national trends, so we’ve included a Local Lowdown below to provide you with in-depth coverage for your area. As always, we will continue to monitor the housing and economic markets to best guide you in buying or selling your home.
Note: You can find the charts/graphs for the Local Lowdown at the end of this section.
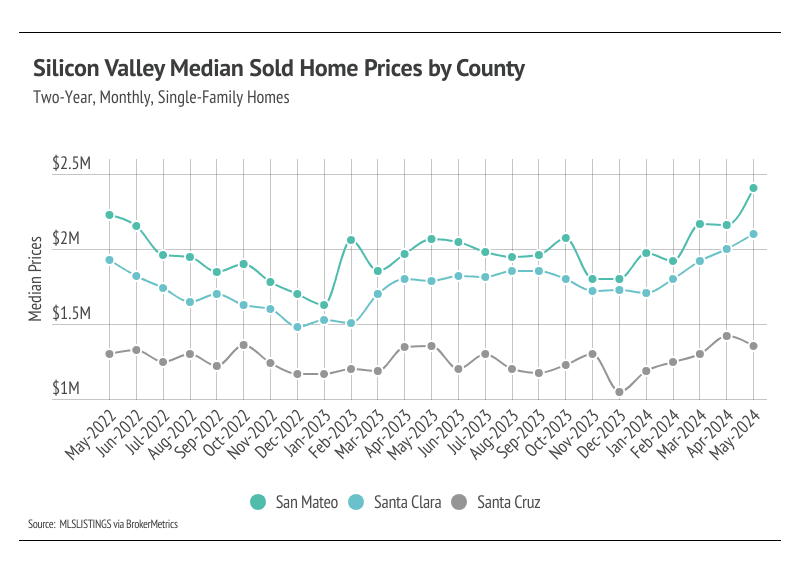
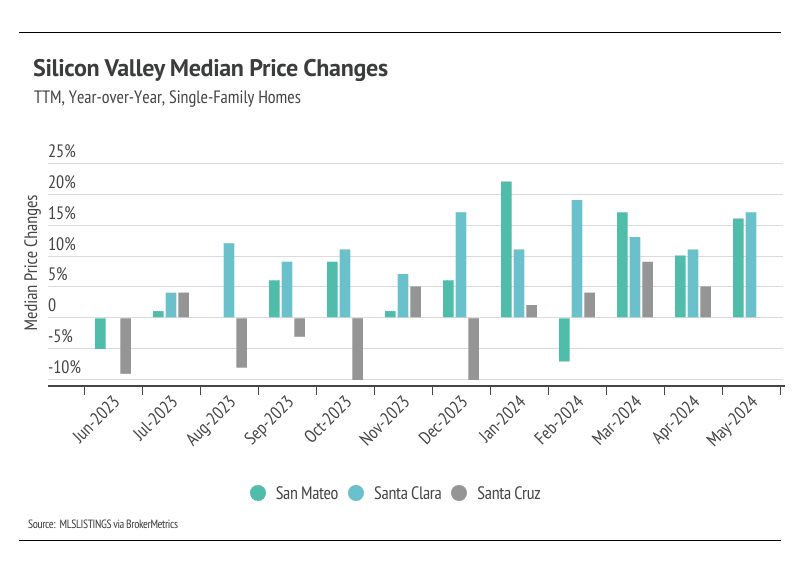
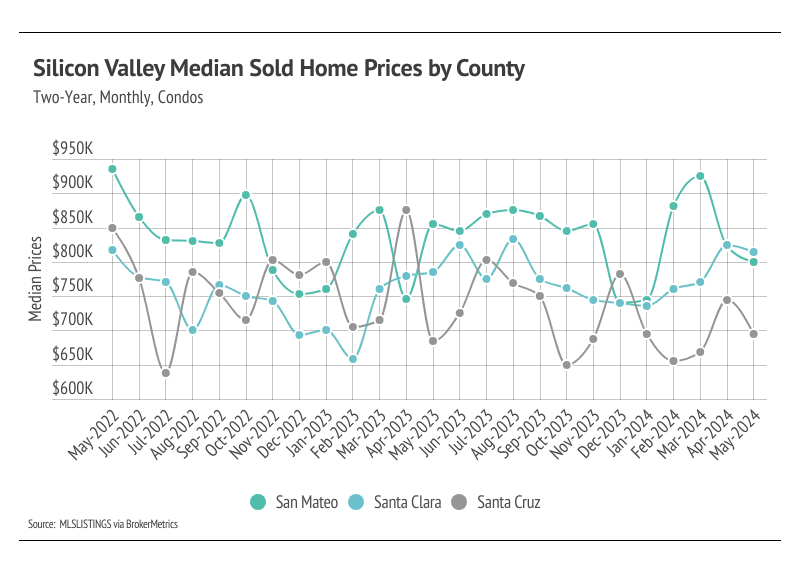
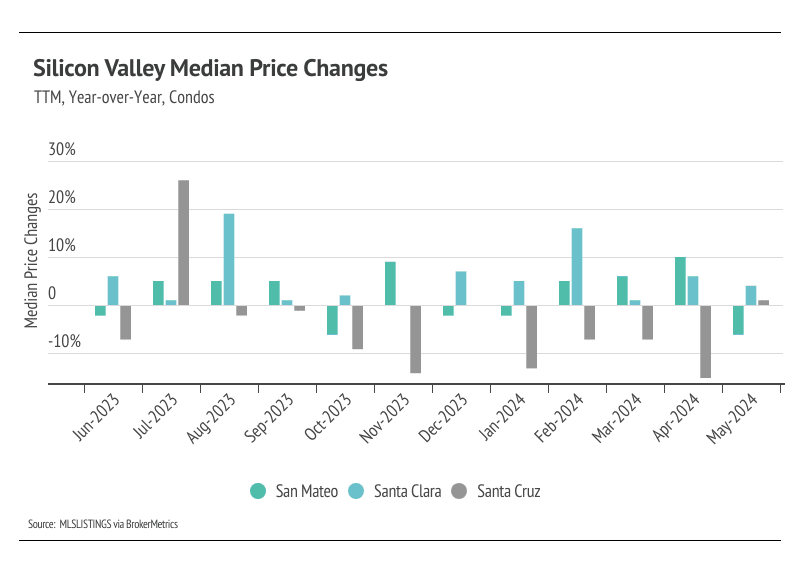
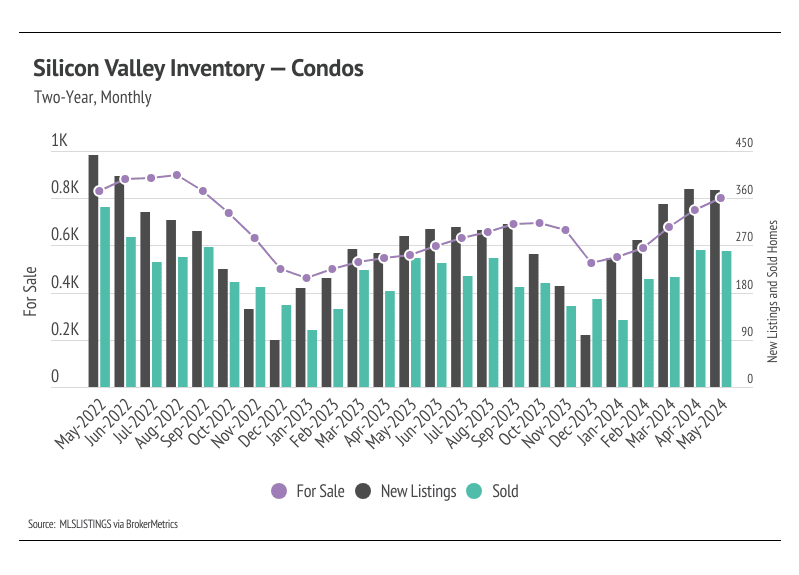
In Silicon Valley, low inventory and high demand have more than offset the downward price pressure from higher mortgage rates. Home prices haven’t been largely affected by rising mortgage rates after the initial period of price correction from May 2022 to January 2023. In 2023, prices trended horizontally, but in 2024, prices have begun to rise meaningfully. Month over month, in May, the median single-family home price rose 12% in San Mateo and 5% in Santa Clara, but fell 5% in Santa Cruz. Conversely, condo prices fell slightly month over month across Silicon Valley. We expect prices in Silicon Valley to remain at or near peak until the early summer. Low, but rising inventory is buoying prices as buyers are better able to find the best match.
High mortgage rates soften both supply and demand, but home buyers and sellers seemed to tolerate rates above 6%. Now that rates are above 7%, sales could slow once again during the time of the year when sales tend to be at their highest.
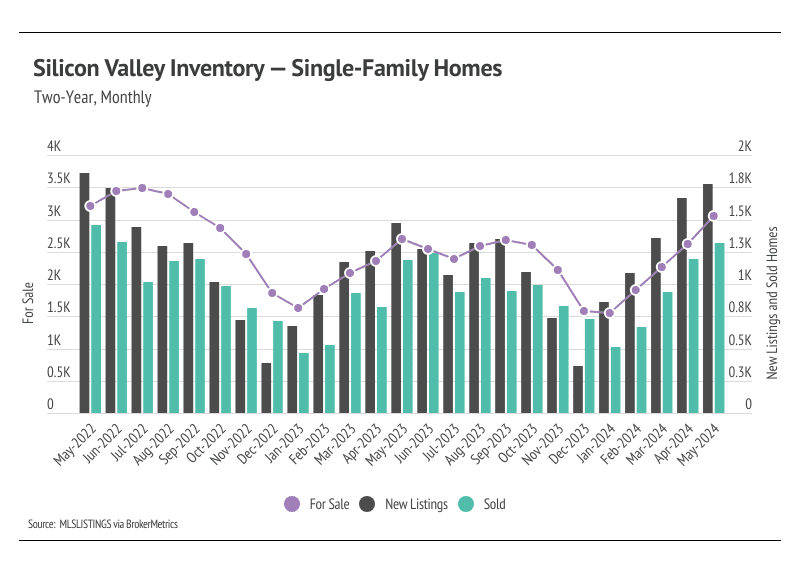
Since the start of 2023, single-family home inventory has followed fairly typical seasonal trends, but at significantly depressed levels. Low inventory and fewer new listings have slowed the market considerably. Typically, inventory peaks in July or August and declines through December or January, but the lack of new listings prevented meaningful inventory growth. Last year, new listings and sales peaked in May, while inventory peaked in September. New listings have been exceptionally low, so the little inventory growth in 2023 was driven by softening demand. In December 2023, inventory and sales dropped, but more new listings have come to the market in 2024, which has driven the significant increase in sales so far this year. The market is already looking healthier, and we expect more new listings and sales in the summer months.
With the current inventory levels, the number of new listings coming to market is a significant predictor of sales. New listings rose 5% month over month, and sales followed suit, increasing 9%. Year over year, inventory is up 19%, and sales are up 10%. Demand is clearly high in Silicon Valley, and more homes for sale have equated to more homes sold.
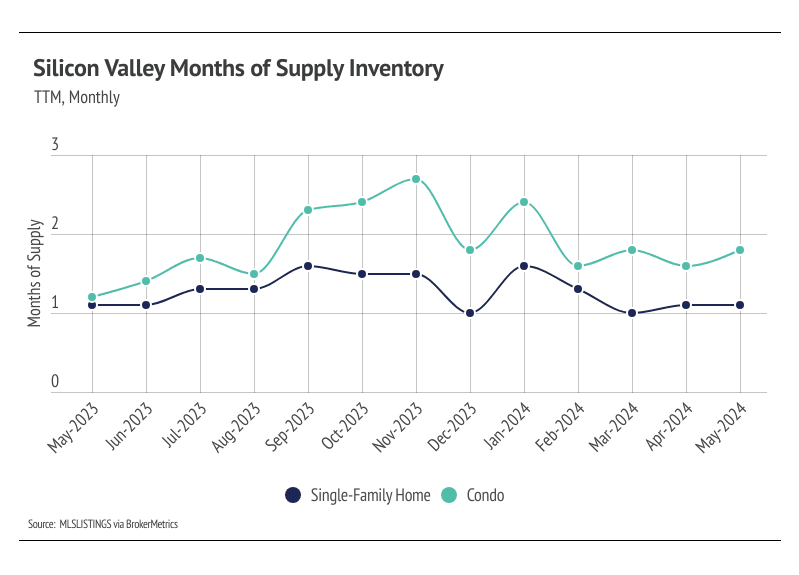
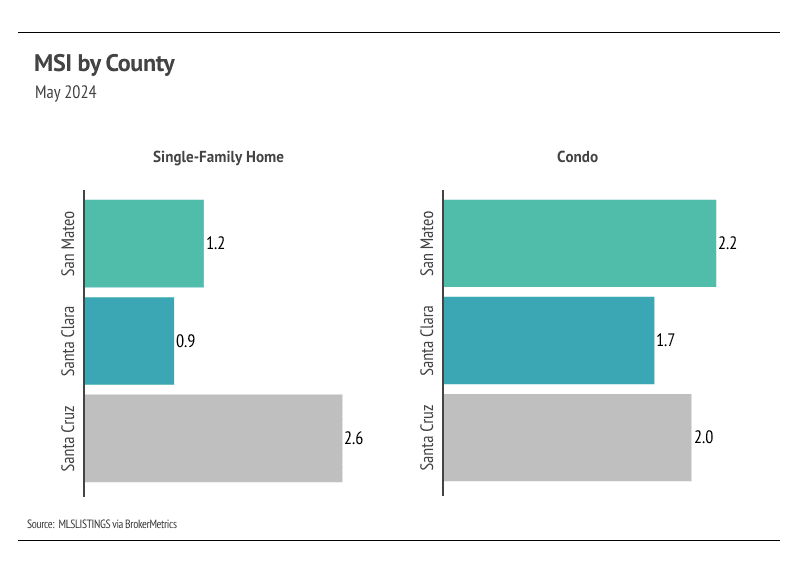
Months of Supply Inventory (MSI) quantifies the supply/demand relationship by measuring how many months it would take for all current homes listed on the market to sell at the current rate of sales. The long-term average MSI is around three months in California, which indicates a balanced market. An MSI lower than three indicates that there are more buyers than sellers on the market (meaning it’s a sellers’ market), while a higher MSI indicates there are more sellers than buyers (meaning it’s a buyers’ market). The Silicon Valley market tends to favor sellers, which is reflected in its low MSI. MSI trended higher in the second half of 2023, but never climbed above three months of supply. From January to April 2024, single-family home and condo MSI fell significantly, indicating the housing market strongly favors sellers.
Stay up to date on the latest real estate trends.

Buying a home in Menlo Park requires more than a strong offer — it requires strategy, preparation, and expert representation. This guide explains how buyers can compet… Read more

Preparing a Los Altos Hills estate for sale requires more than simple cosmetic updates. Today’s luxury buyers are paying close attention to property condition, wildfir… Read more

Spring momentum continues to shape the Silicon Valley housing market in May 2026. In this month’s market update, we break down the latest trends affecting buyers and s… Read more

Planning to sell your Los Altos Hills estate? Learn how to price, prepare, disclose, and market your luxury property for maximum value in today’s Silicon Valley market.

Explore new construction and spec home trends in Menlo Park, including luxury design features, emerging neighborhoods, and what buyers and sellers should know.

Compare Los Altos vs. Los Altos Hills living. Discover differences in lifestyle, homes, commute, and schools to find the right Silicon Valley community for you.
You’ve got questions and we can’t wait to answer them.