Silicon Valley Newsletter - April 2025
Real Estate

Real Estate
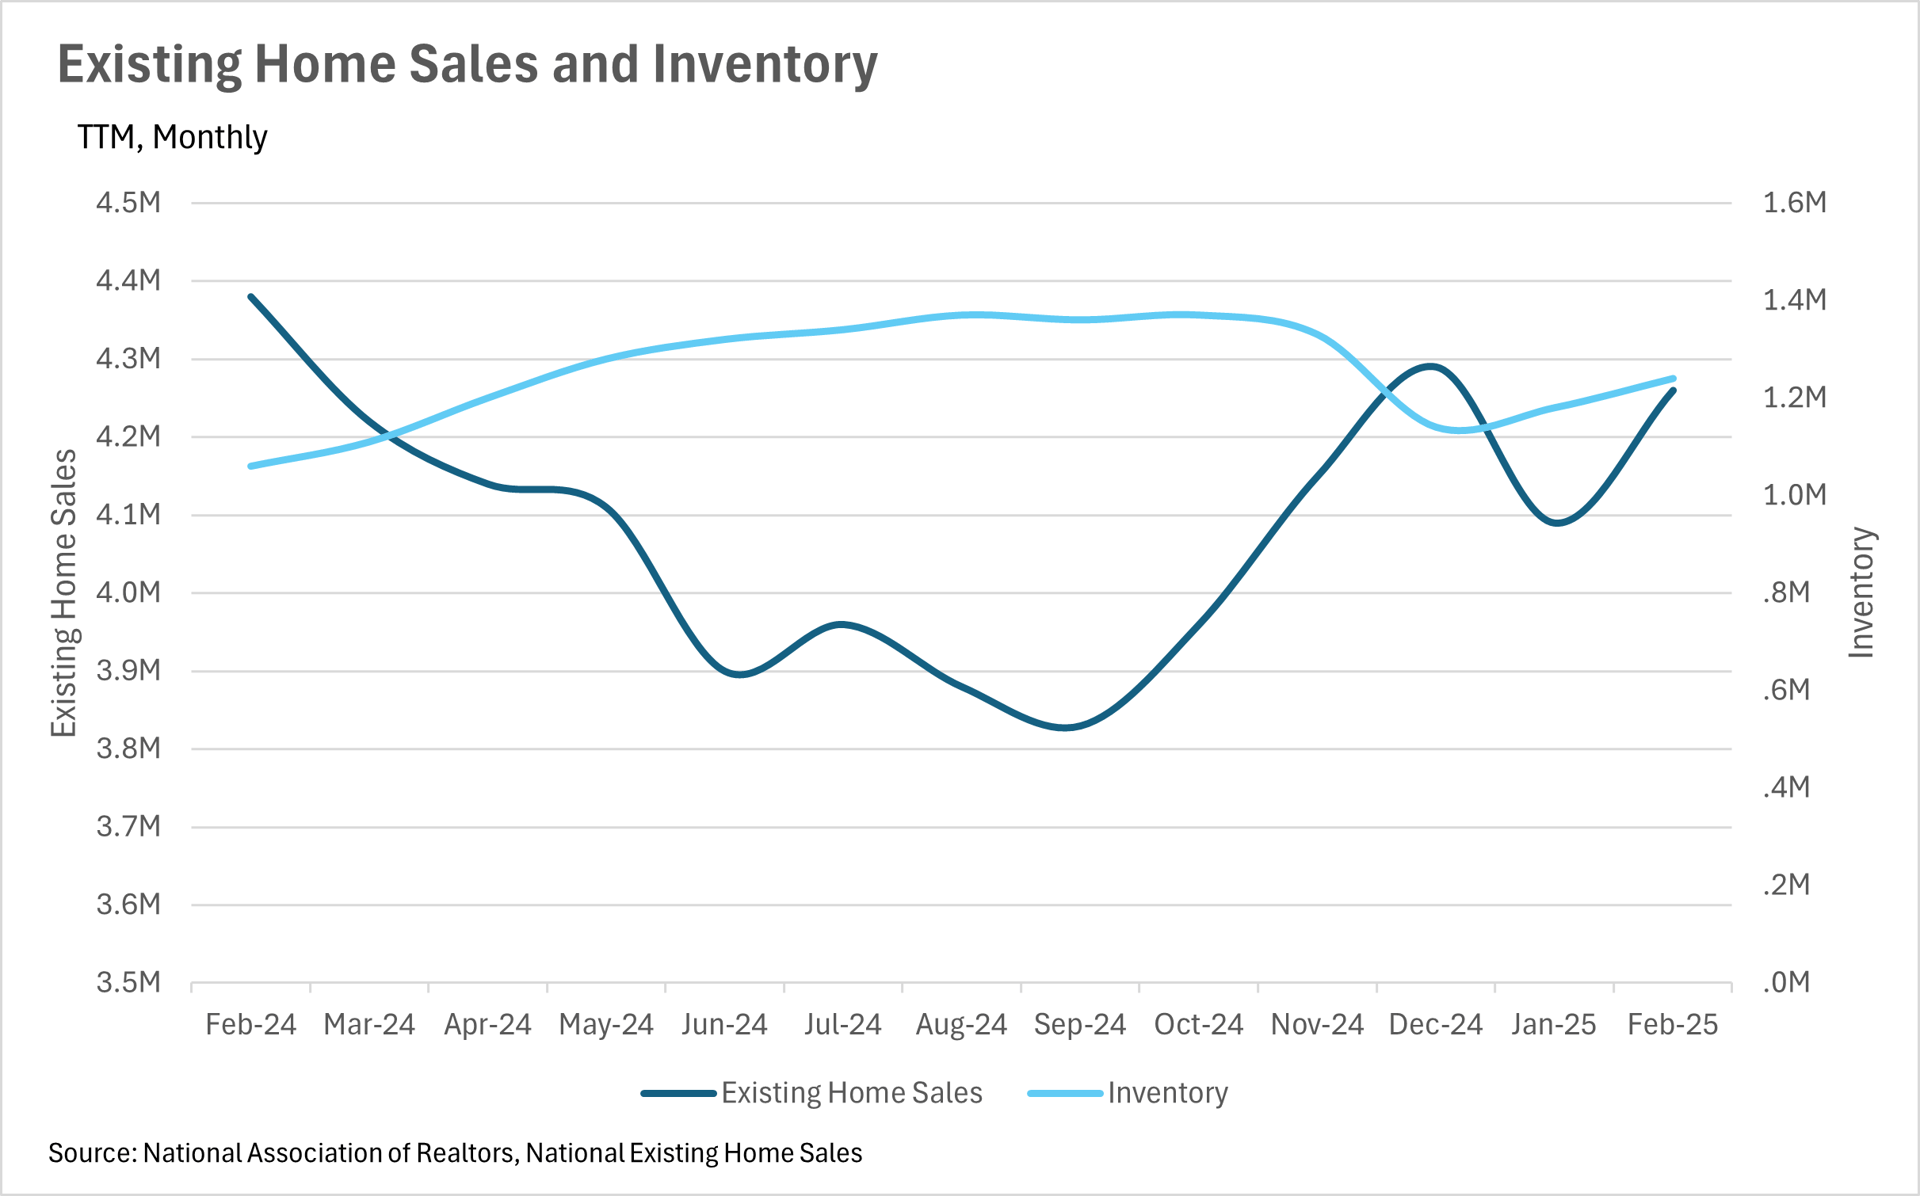
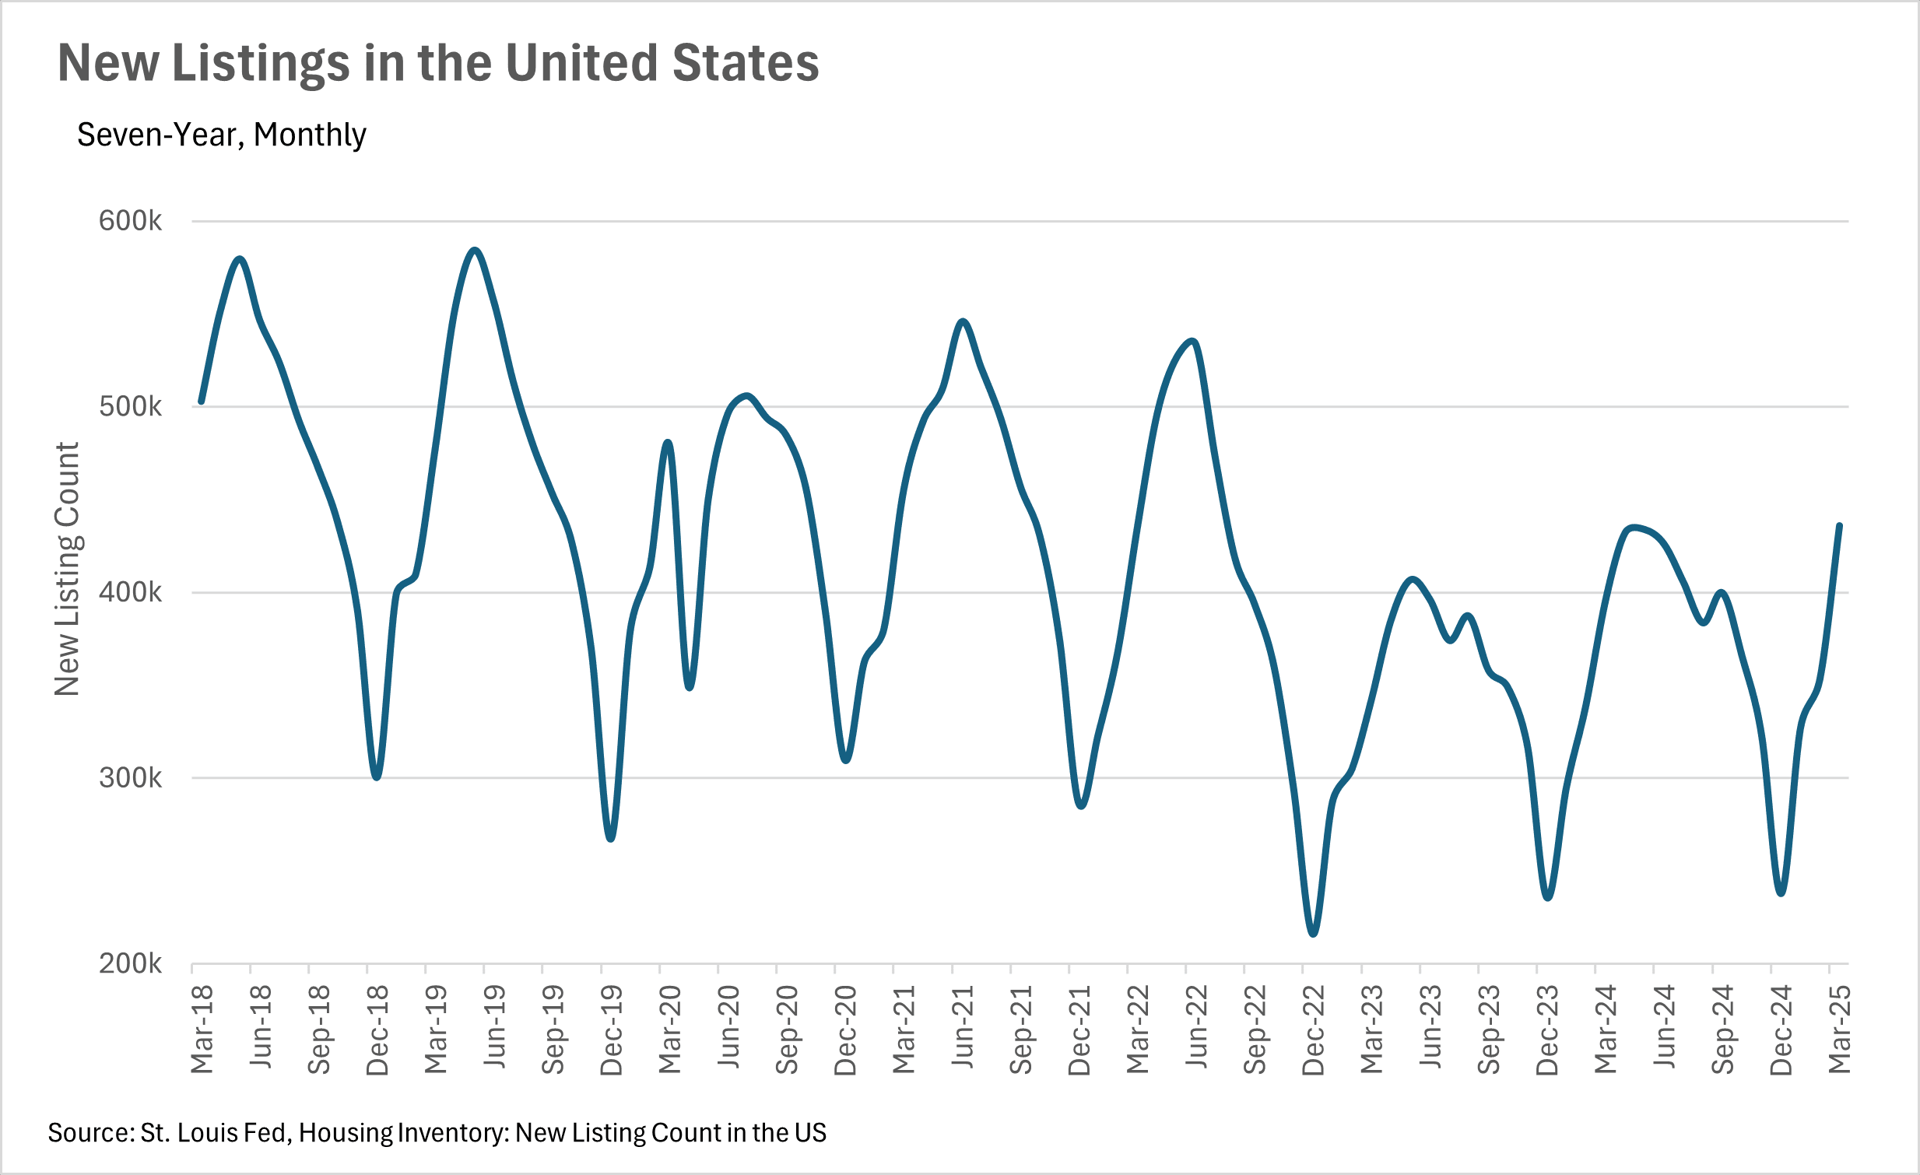
Although we are just about to exit the slow season for real estate sales, things are looking great overall. We saw a slight decrease in the number of sales on a year-over-year basis in February, with there being 4,260,000 sales in February 2025, compared to 4,380,000 in February 2024. However, on the flip side, we saw considerably more inventory added this year, with 1,240,000 homes on the market in February of this year, compared to 1,060,000 homes on the market around this time last year.
This means that all over the country, buyers have many more options than in recent years, which may lead to listings sitting on the market for a bit longer than what we’ve seen over the past couple of years. When you couple this with the fact that there are more new listings being added to the market, with just over 10% more listings added in March of 2025, compared to March of 2024, we might see some power start moving away from sellers to the buyers.
Additionally, this uptick in new listings might be an indication that sellers are starting to accept the fact that considerably lower mortgage rates aren’t coming anytime soon. Although many were holding out hope over the course of the past couple of years, the Fed has made it very clear that they’re not looking to drop rates by a considerable margin anytime soon. This, of course, means that prospective sellers have an important choice to make - whether they should sell, or continue holding out. From the data that we’re seeing, it seems that many sellers are beginning to choose the former option!
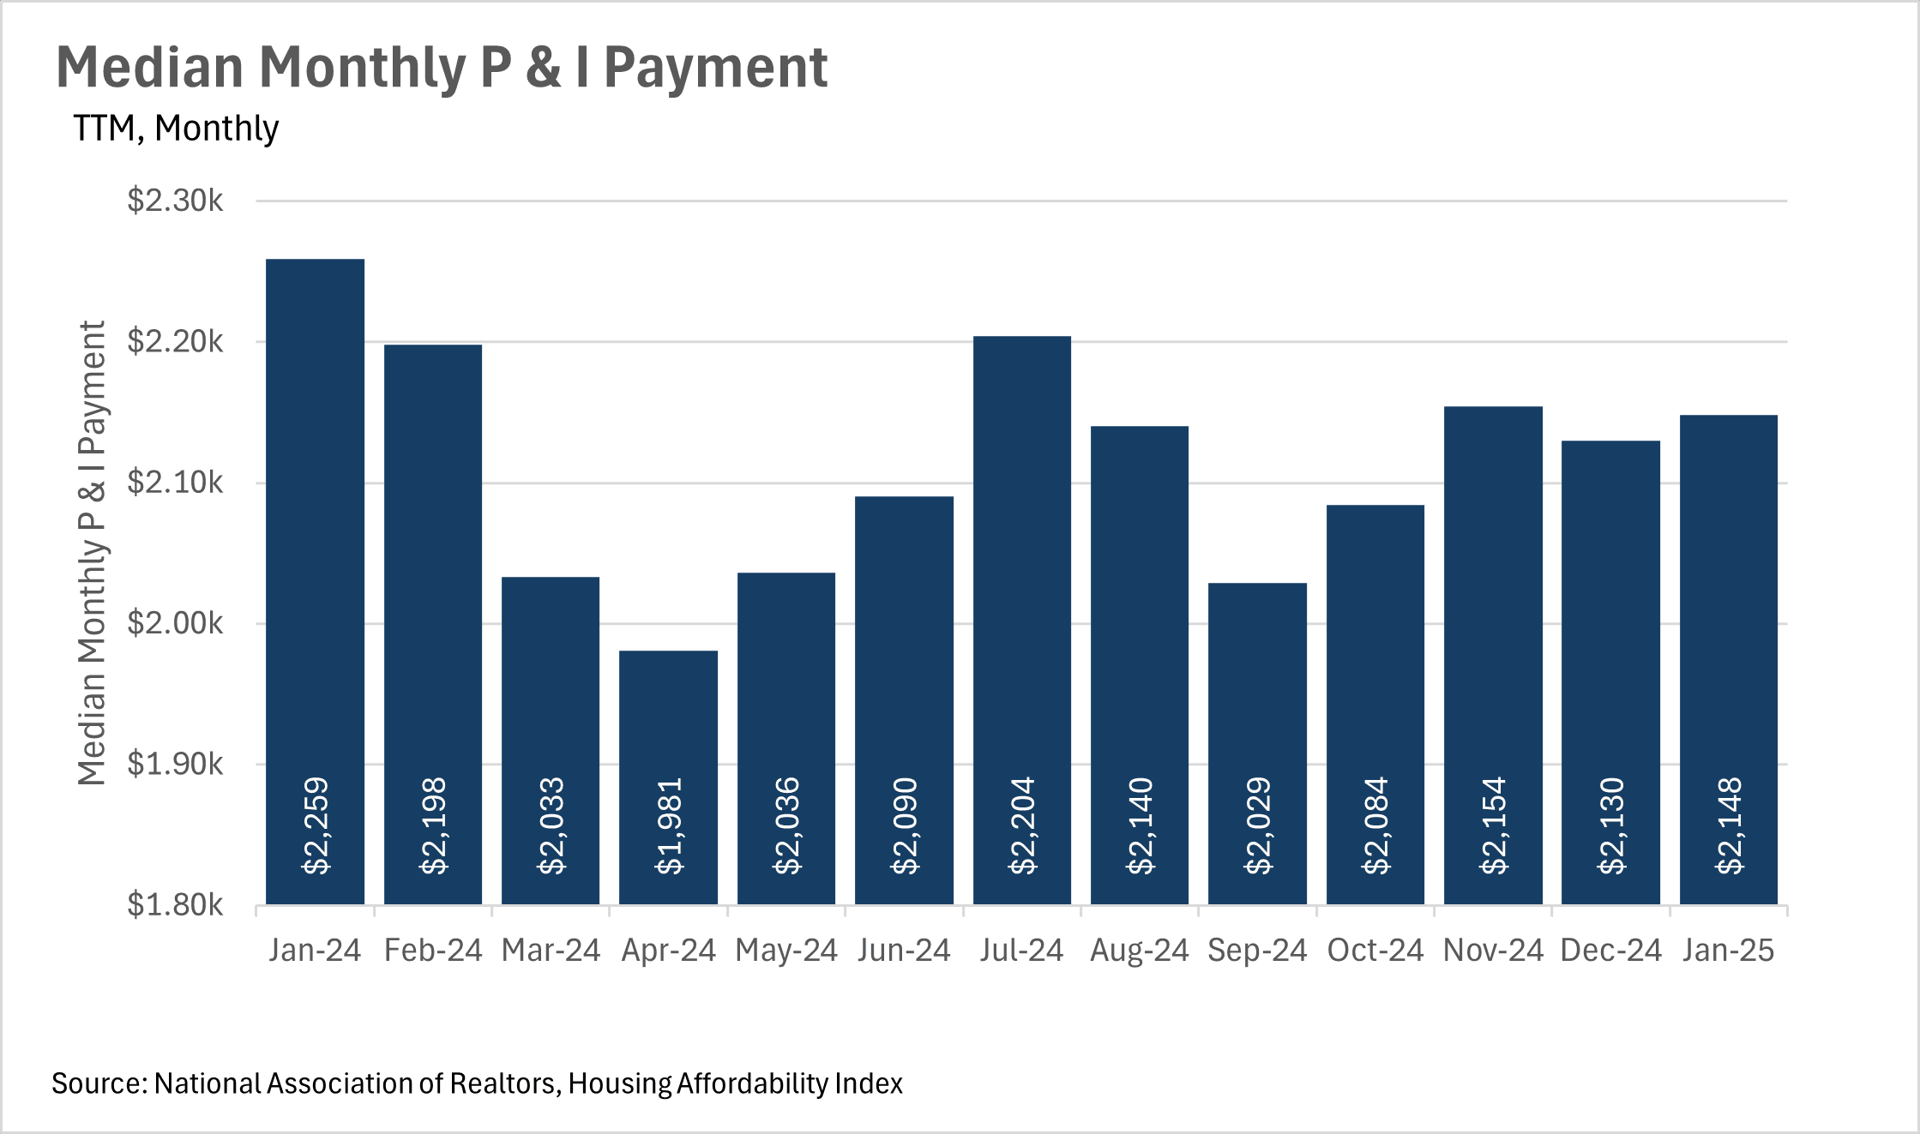
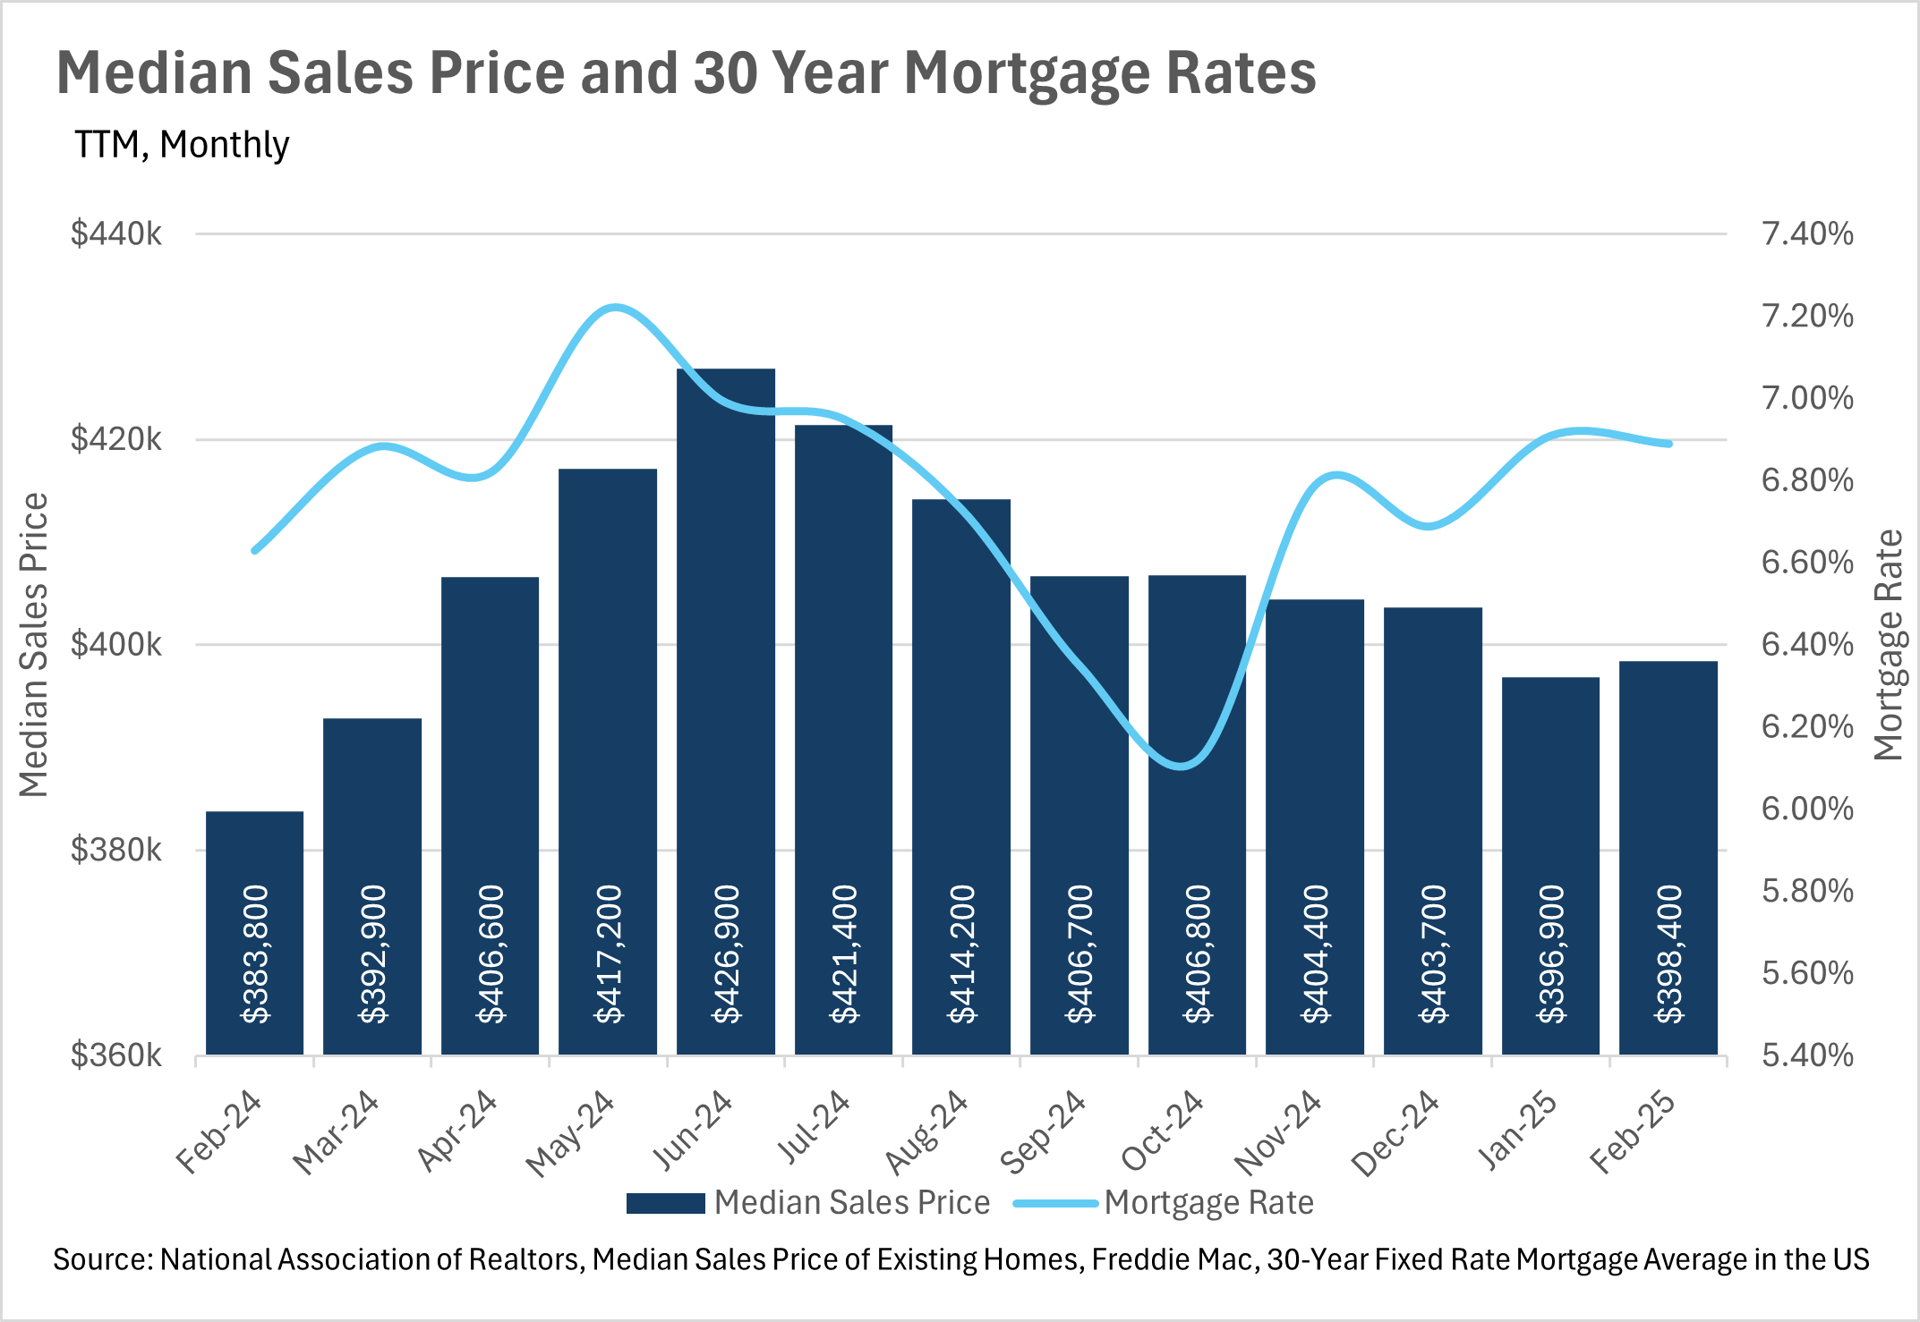
When turning to affordability, we saw a rather interesting phenomenon - median monthly P&I payments decreased by nearly 5%, all while interest rates and median sale prices increased by just under 4%. This likely means that there was a considerable cohort of homeowners out there that locked in rates toward the end of 2023 when rates were at a local high, and recently refinanced when rates came down a bit. The median consumer having an additional $100 in their pocket each and every month is a great thing for the economy, especially when we face economic uncertainty, tariffs, and ever-changing geopolitics!
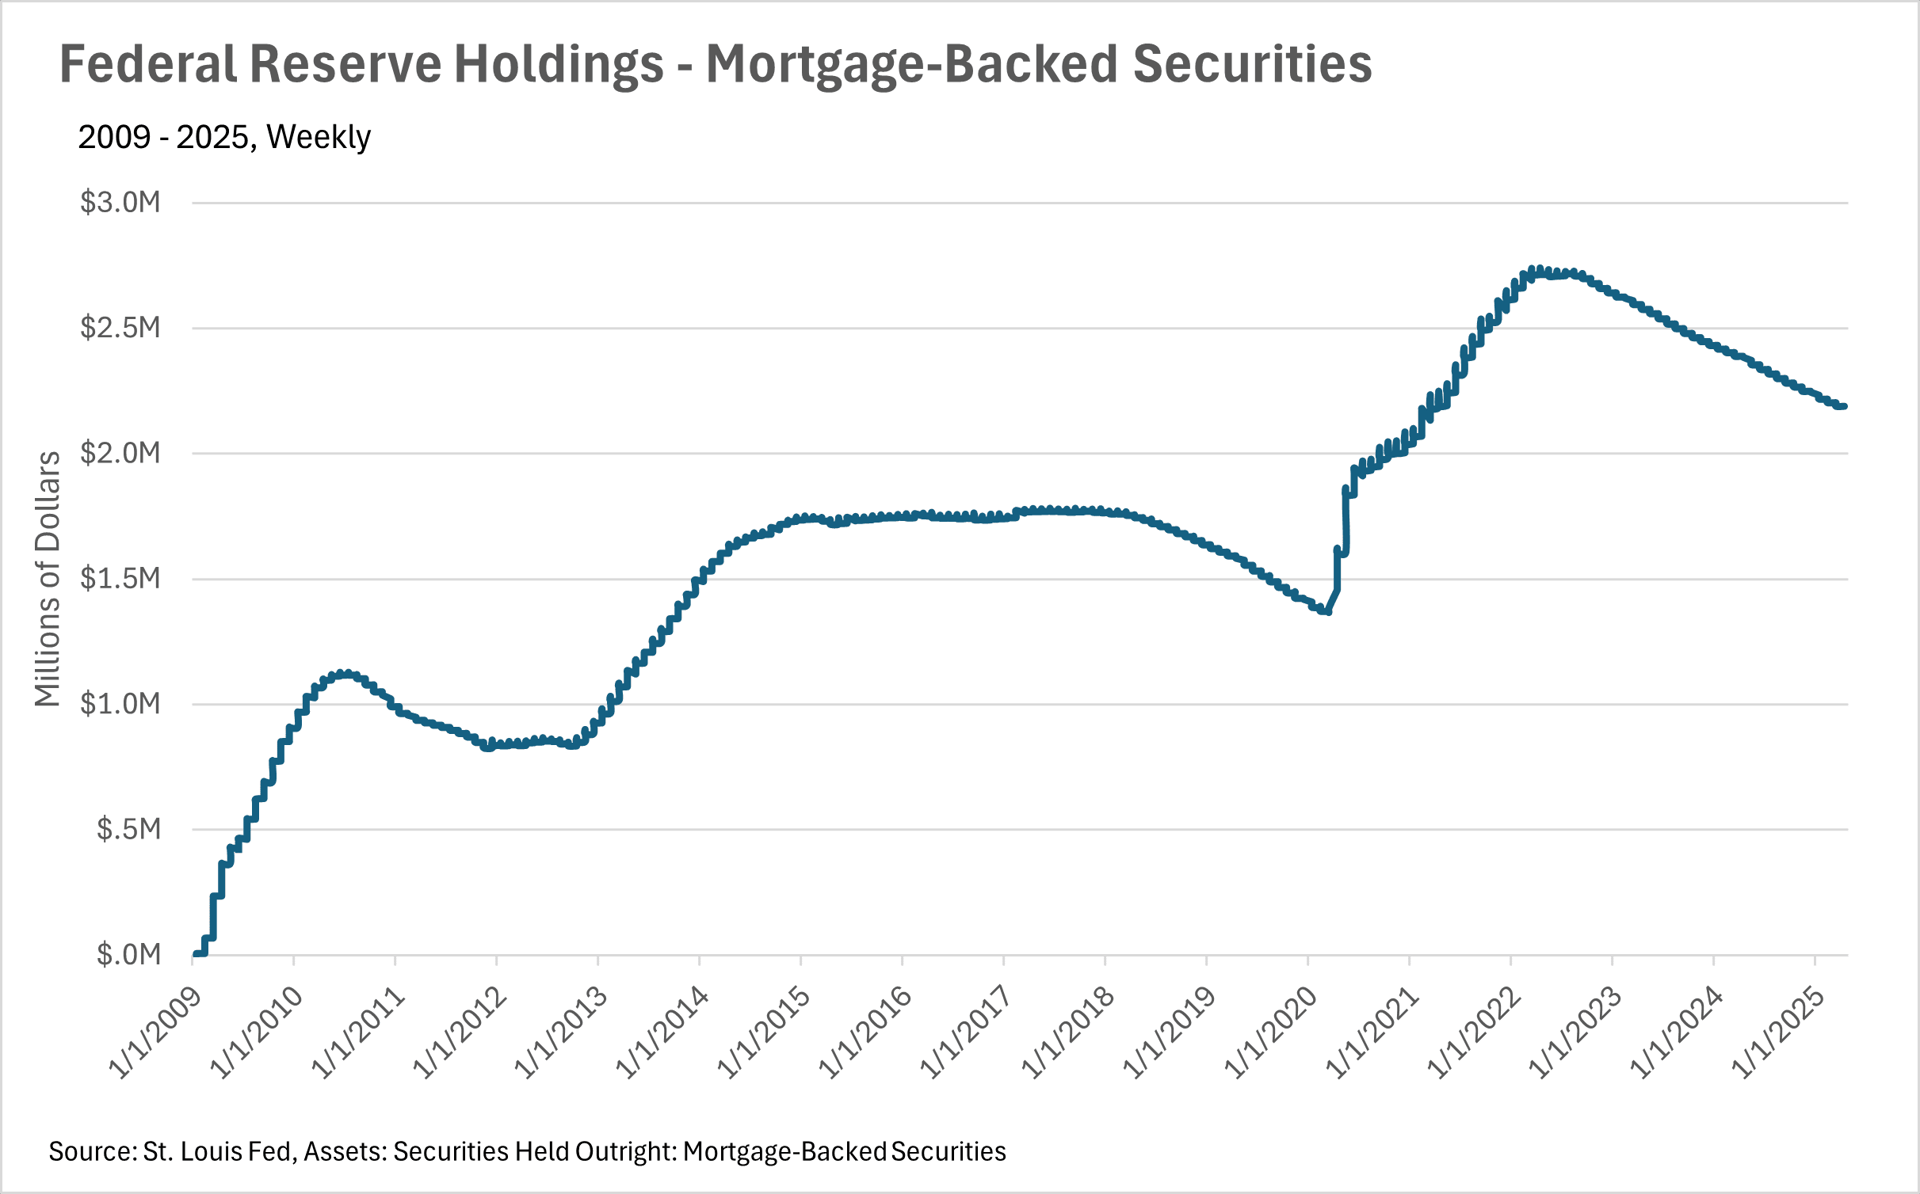
Lastly, it’s important to note that it’s business as usual in terms of the Federal Reserve. In their recent FOMC meeting, they decided to hold the federal funds rate firmly where it has been over the past couple of months. Fed officials also indicated that they are not in a rush to lower rates by a considerable margin anytime soon. However, that could always change, as we’re living in an incredibly dynamic era right now! Additionally, the Fed is continuing to offload mortgage-backed securities at a steady pace!
Ultimately though, this is just what we’re seeing at a national level. As we all know, real estate is an incredibly localized industry, so knowing what’s going on in your own market is pivotal. Below is our local lowdown, that outlines everything you need to know about what’s happening around you in your neighborhood and surrounding areas!
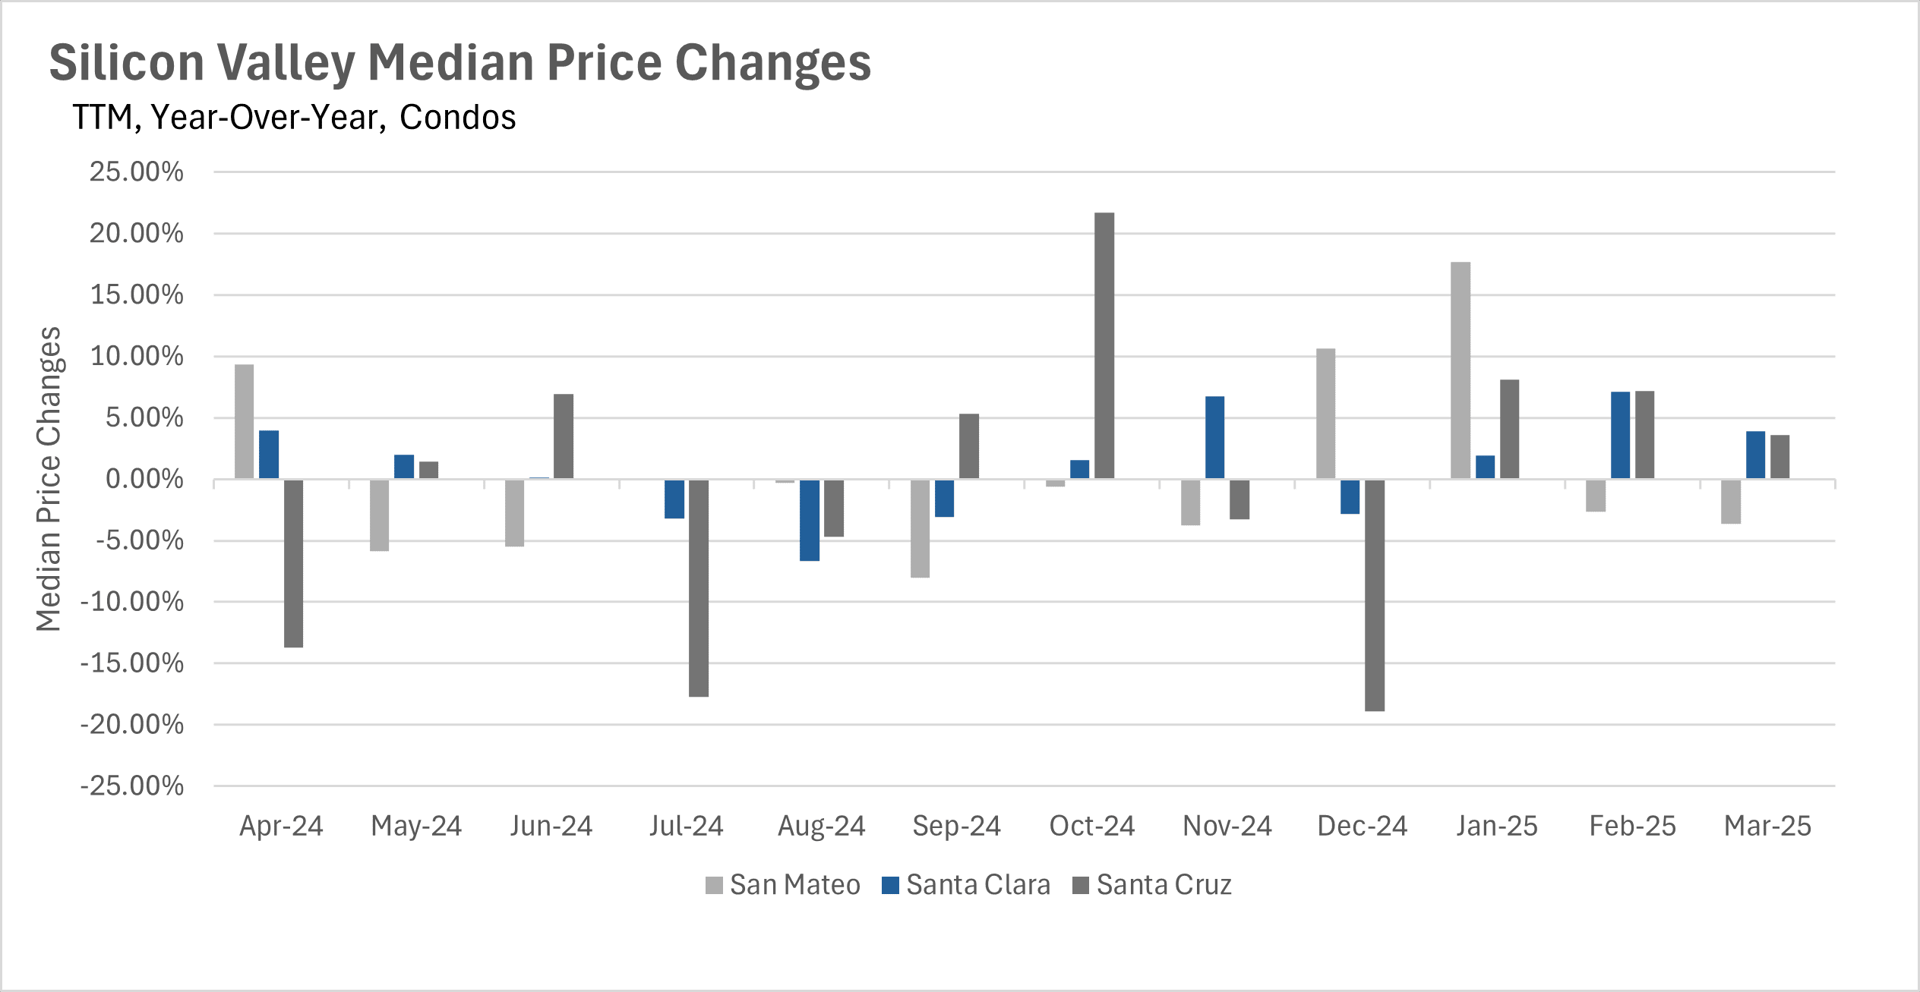
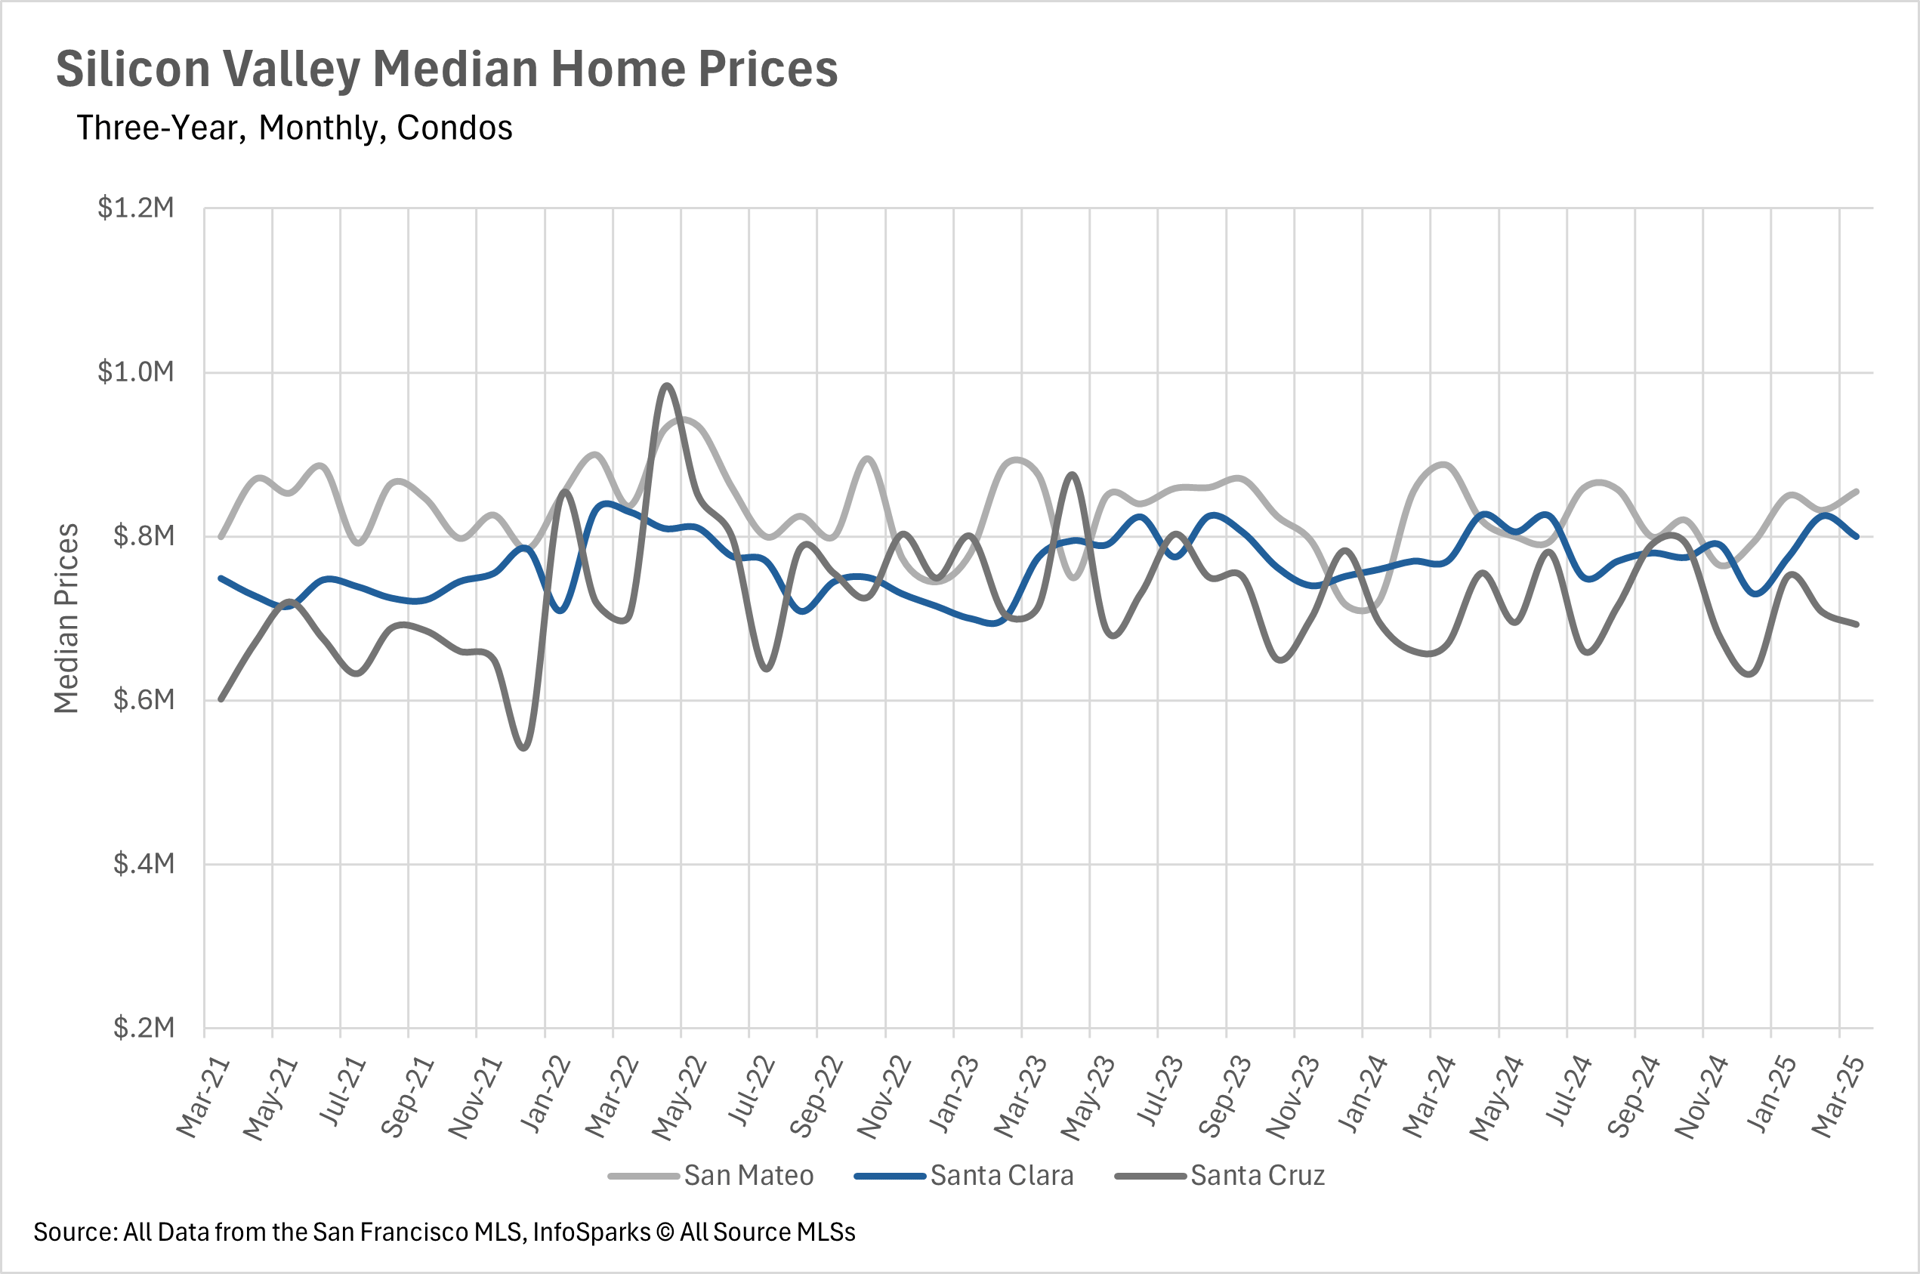
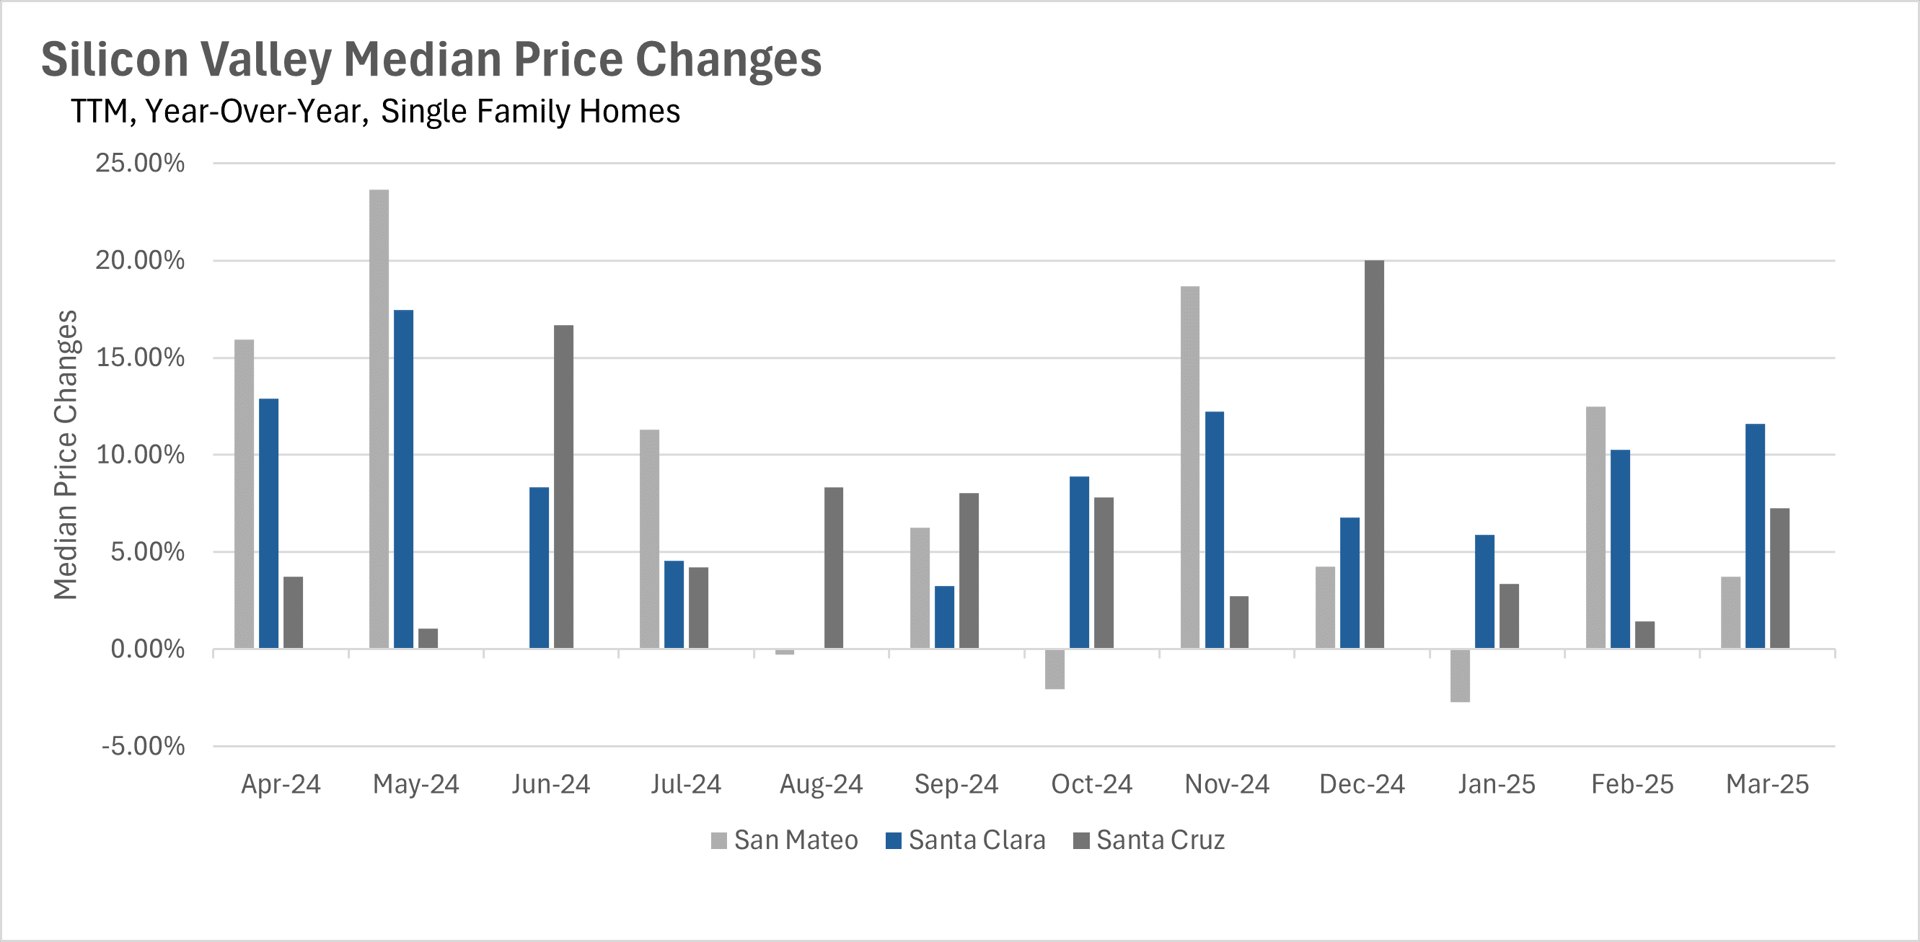
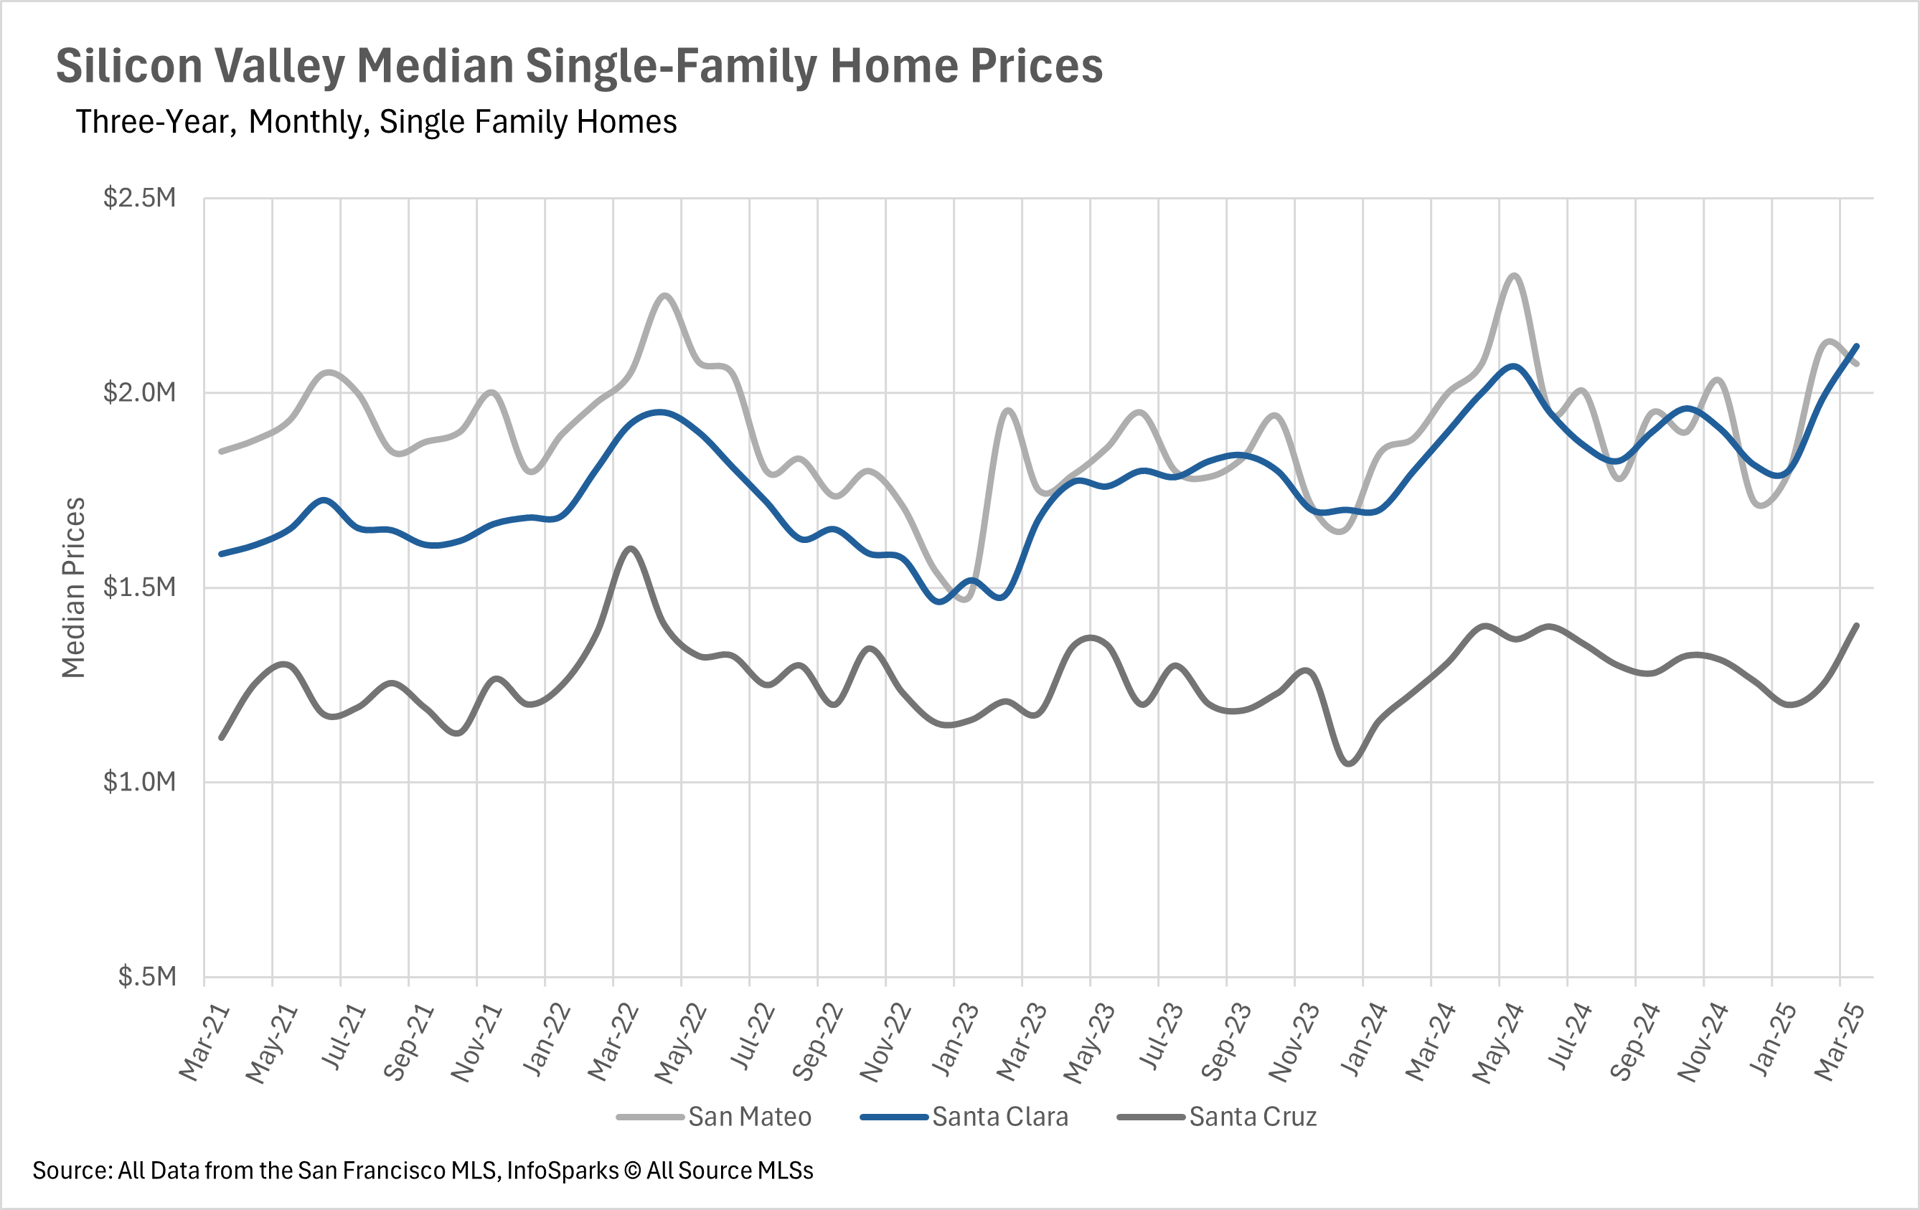
Throughout recent years, Silicon Valley has been a great area for homeowners and real estate investors alike to invest. That is because the area has experienced a considerable amount of appreciation each year. So far, in 2025, it looks like Silicon Valley is upholding that reputation! In the month of March, we saw the median sale price for a home in San Mateo increase by 3.75% on a year-over-year basis, while median sale prices in Santa Cruz increased by 7.27%, and median sale prices in Santa Clara increased by a whopping 11.58%. This large increase in Santa Clara County came on the heels of a 10.28% year-over-year increase in February!
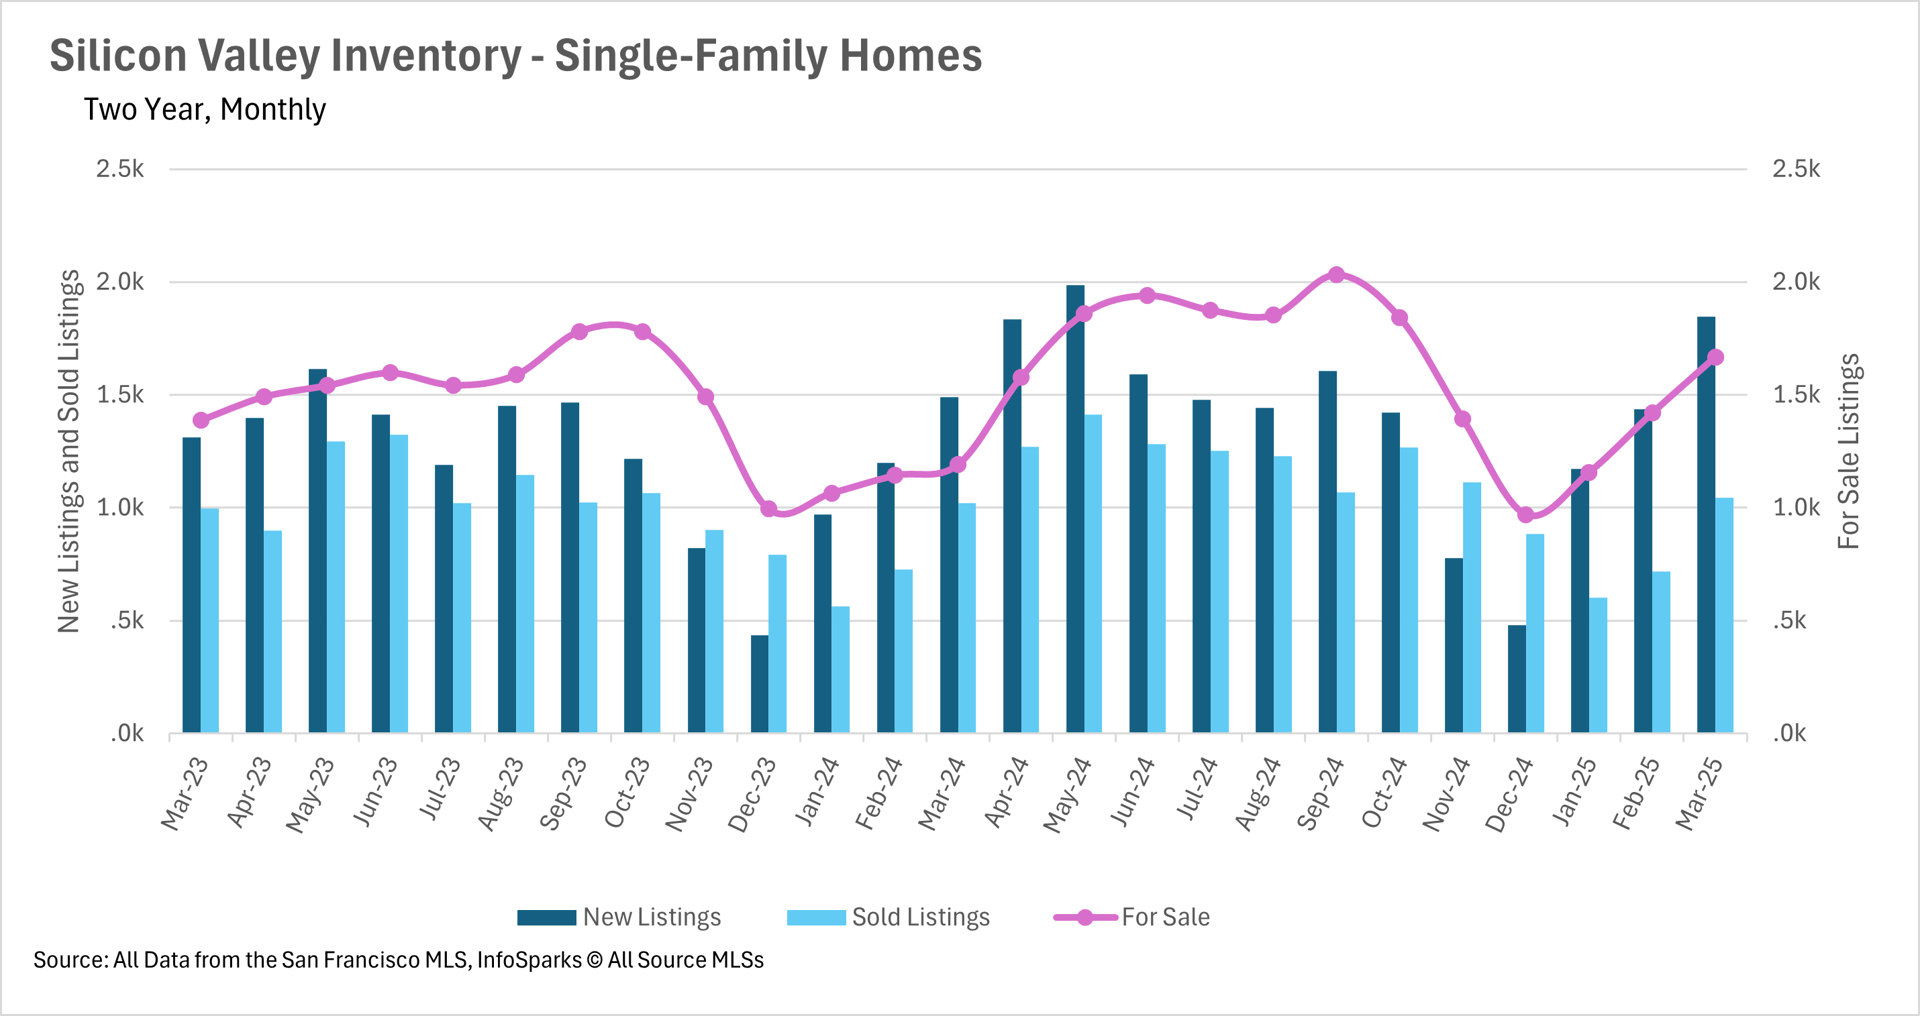
After hearing that prices are increasing throughout Silicon Valley, you might think that there might be inventory issues on the horizon. However, that doesn’t seem to be the case. In the month of March, we saw single-family home inventories increase by 40.05%. This was largely due to the fact that the amount of new listings hitting the market skyrocketed by 23.83% when compared to last year. Additionally, roughly the same number of homes were sold. Moving forward, it will be important to keep an eye on inventory levels, as if they get too high, and buyers have more options, we may see prices begin to downtrend!
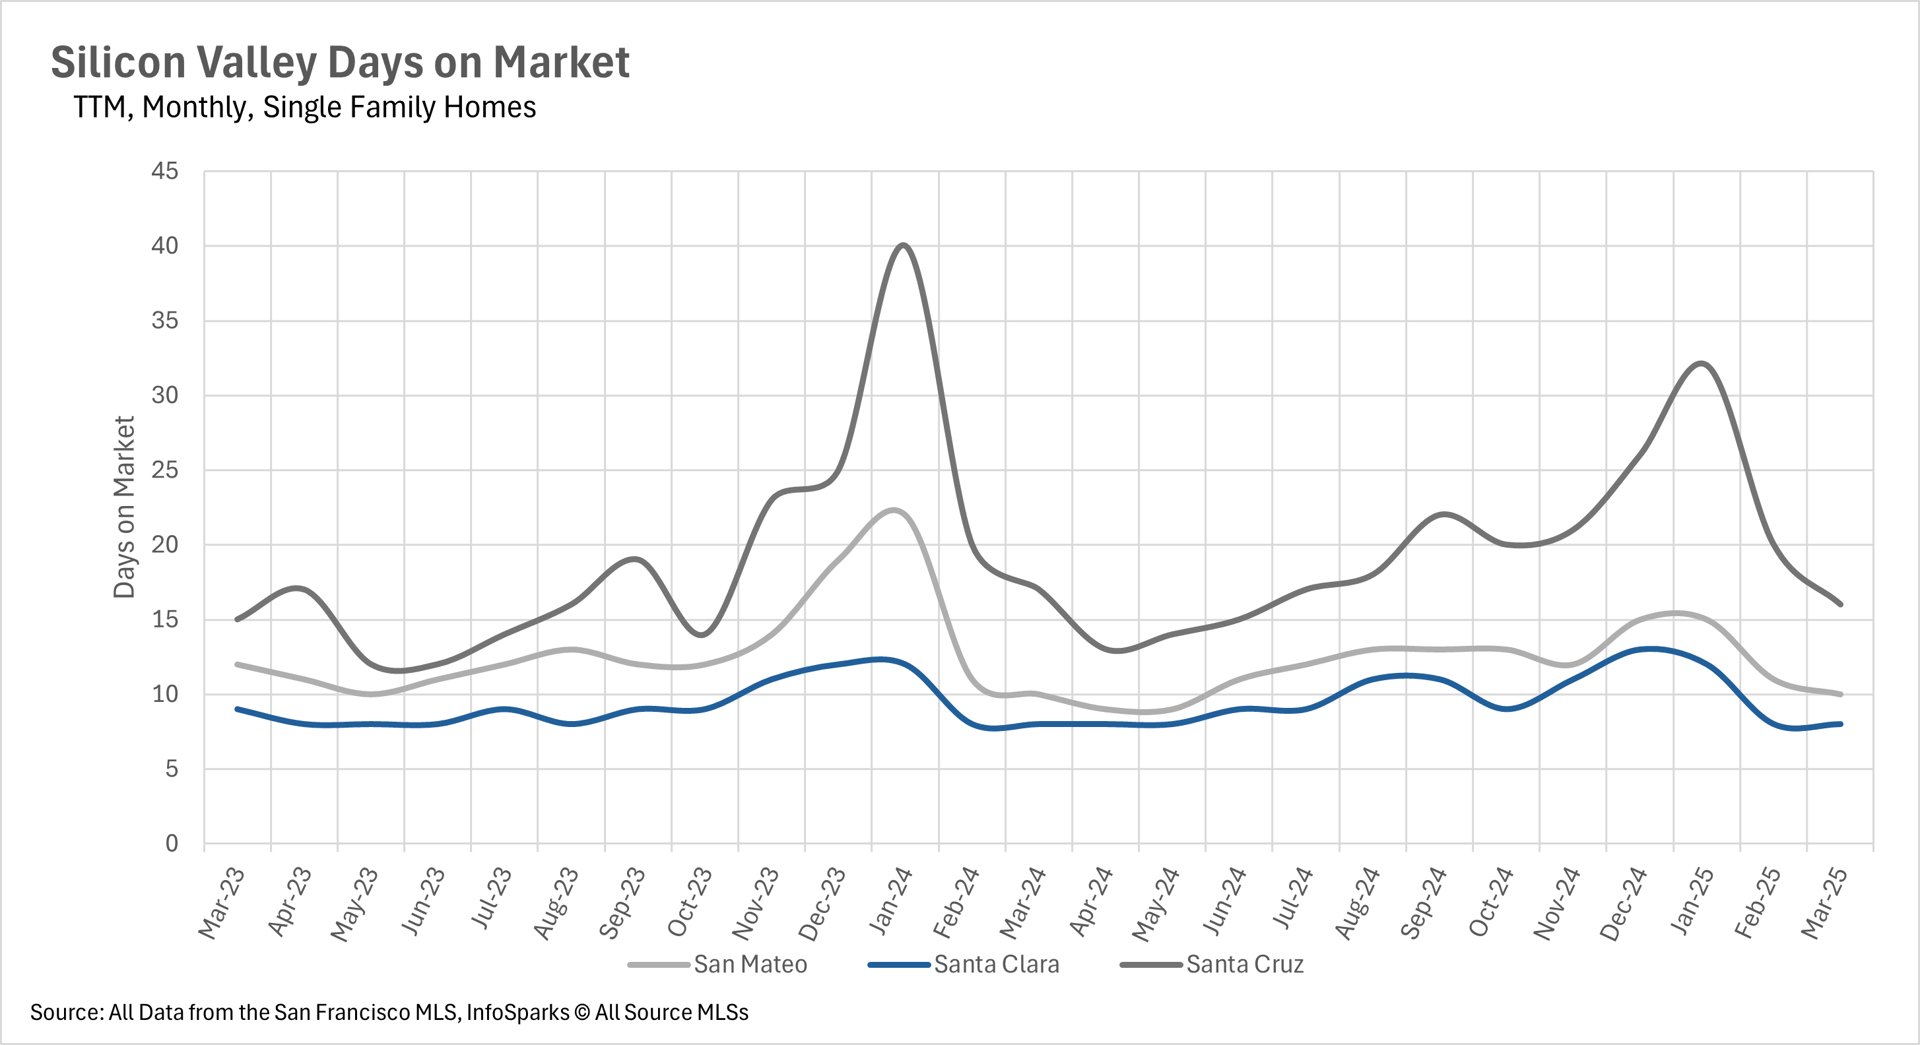
Fortunately for sellers though, we haven’t seen buyers get any more picky! We’re seeing single-family homes spend roughly the same amount of time on the market as they were around this time last year. With that being said, new listings are being snapped up incredibly quickly. The average listing lasts just 16 days in Santa Cruz, whereas the average listing in San Mateo or Santa Clara counties only lasts 10 or 8 days, respectively. This indicates to us that buyers are still incredibly interested in the area, and they’re eager to purchase homes!
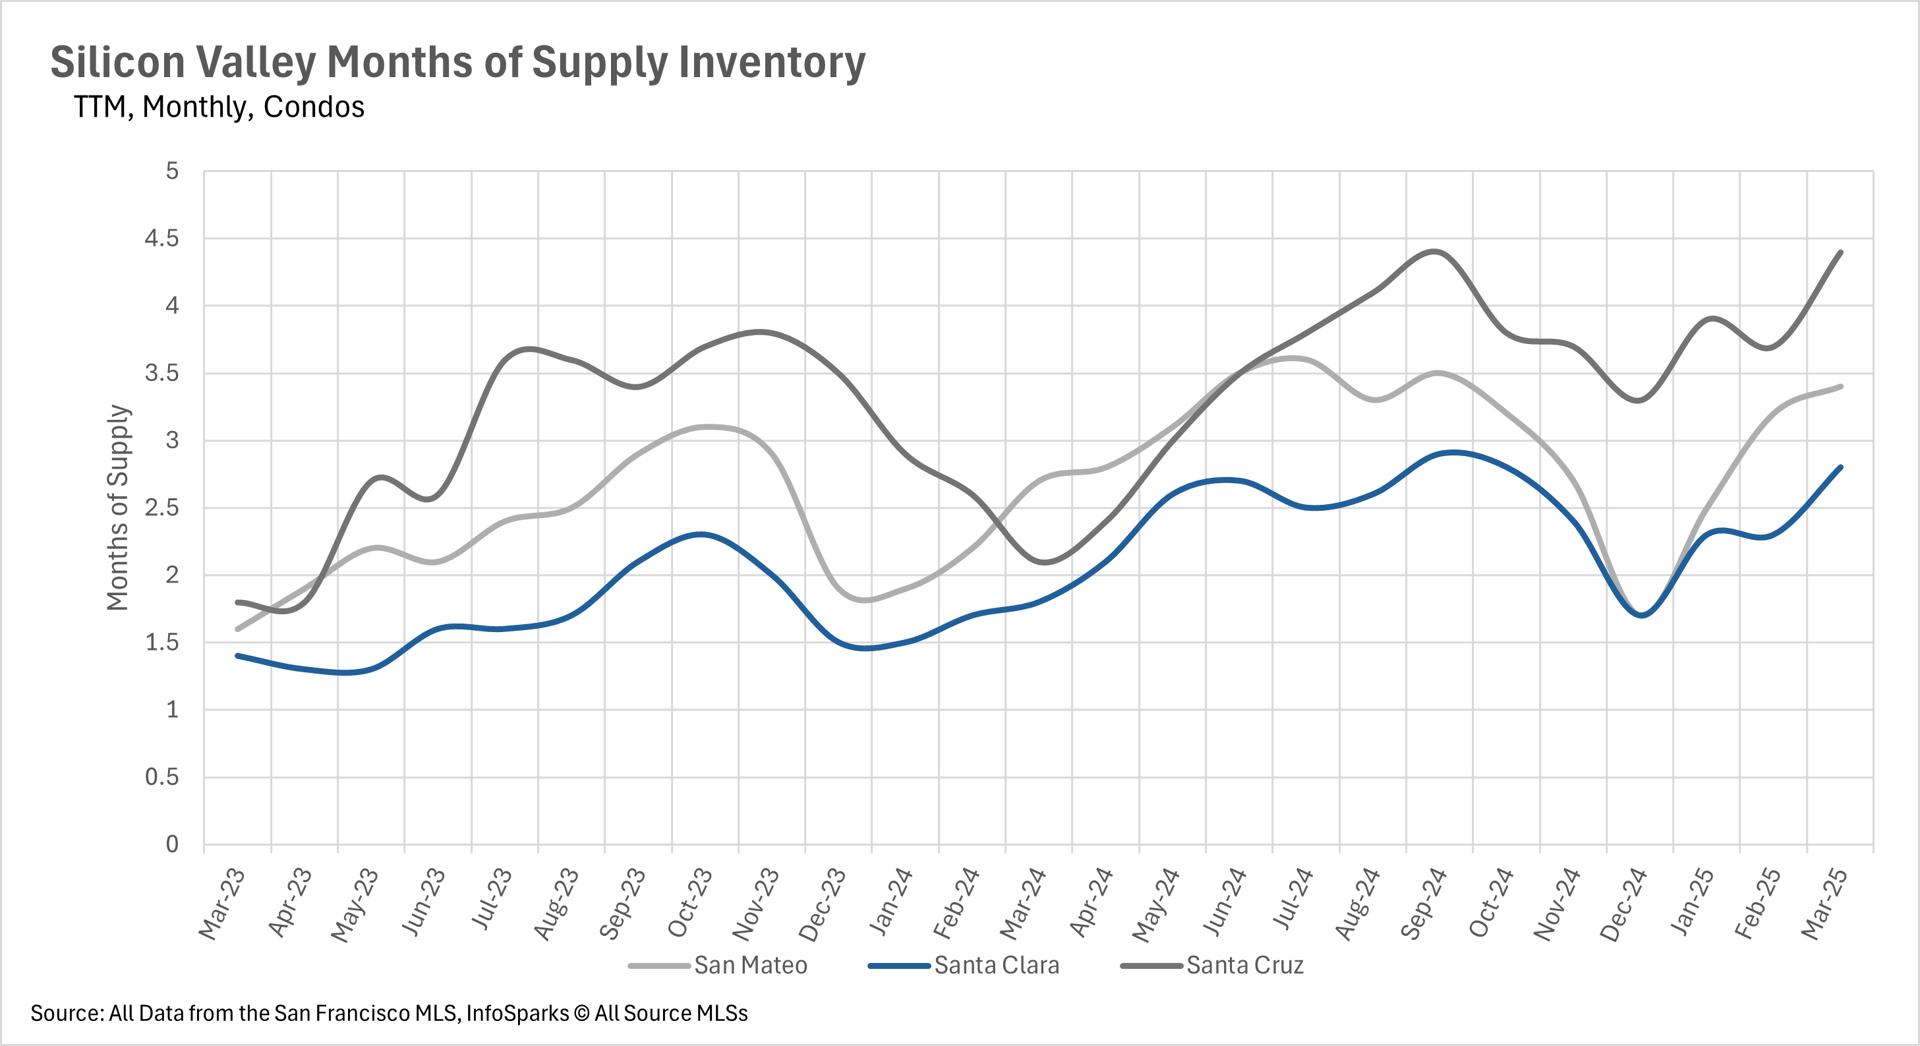
When determining whether a market is a buyers’ market or a sellers’ market, we look to the Months of Supply Inventory (MSI) metric. The state of California has historically averaged around three months of MSI, so any area with at or around three months of MSI is considered a balanced market. Any market that has lower than three months of MSI is considered a sellers’ market, whereas markets with more than three months of MSI are considered buyers’ markets.
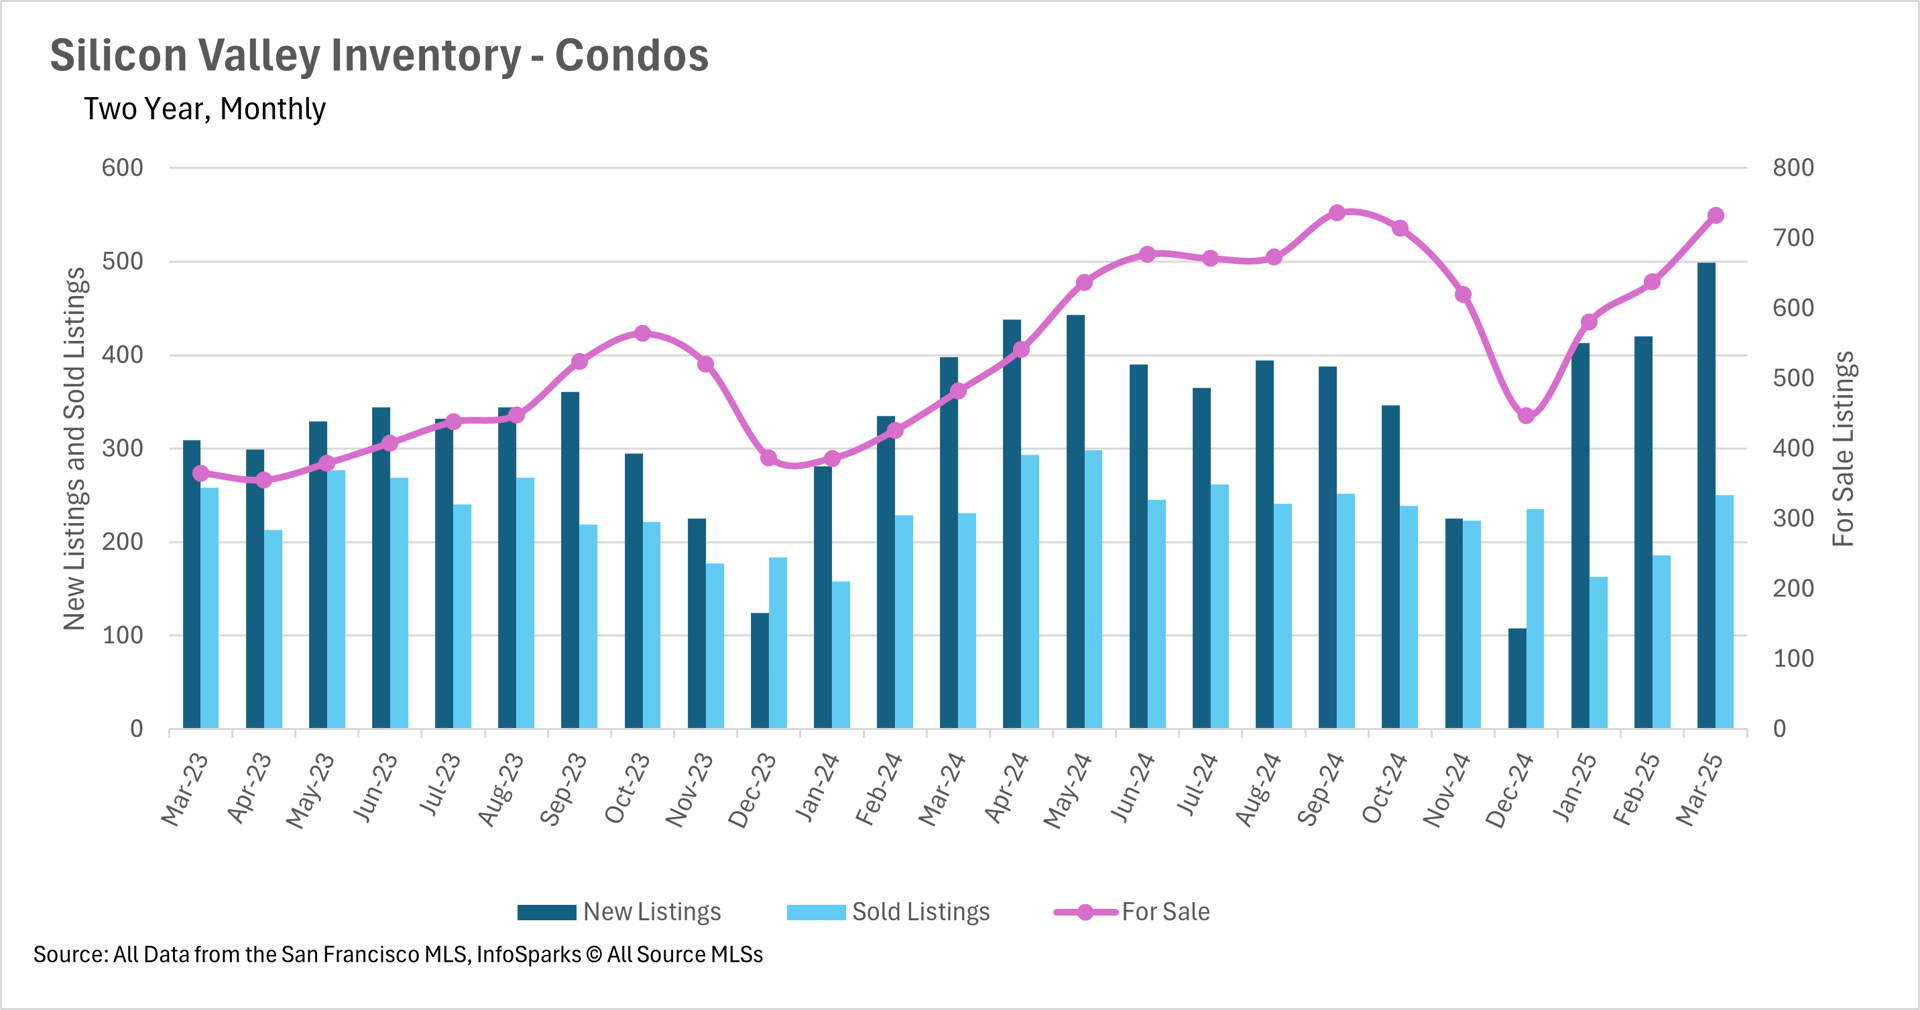
When it comes to the single-family home market, the Santa Cruz area is fairly balanced, with exactly 3 months’ worth of supply on the market right now. However, San Mateo and Santa Clara counties have 1.5 and 1.3 months’ worth of supply on the market right now, making it tough for buyers to find any negotiating leverage. However, the condo market is a completely different story, as it’s much more balanced. There are 2.8 months’ worth of condo supply in the market in Santa Clara County, 3.4 months in San Mateo County, and 4.4 months in Santa Cruz County. This means that Santa Clara County is fairly balanced, and San Mateo and Santa Cruz counties are both buyer-dominated!
Stay up to date on the latest real estate trends.

Discover the fascinating history of Menlo Park’s tech industry, from the invention of the computer mouse and the birth of personal computing to Sand Hill Road venture … Read more
Explore the May 2026 Silicon Valley housing market update. Learn how rising home prices, increasing inventory, lower mortgage rates, and strong buyer demand are shapin… Read more

Discover the best outdoor activities in Los Altos Hills, CA. Explore Hidden Villa, scenic hiking trails, bird watching, photography spots, picnicking, and nature exper… Read more

Planning a home remodel in Los Altos? Learn how to budget, hire contractors, manage permits, avoid delays, and create a stress-free renovation experience with this com… Read more

Buying a home in Menlo Park requires more than a strong offer — it requires strategy, preparation, and expert representation. This guide explains how buyers can compet… Read more

Preparing a Los Altos Hills estate for sale requires more than simple cosmetic updates. Today’s luxury buyers are paying close attention to property condition, wildfir… Read more
You’ve got questions and we can’t wait to answer them.